Impact of Cover Crops and Nitrogen Fertilizer on Inbred Maize Yields in Southern Semi-Arid Puerto Rico
This study investigates the effects of cover crops and nitrogen (N) fertilizer on the seed yield of inbred maize in the semi-arid coastal region of Puerto Rico. Conducted between 2008-2010, the research assessed various treatments, including fallow, velvetbean, and cowpea as cover crops, alongside different N fertilizer levels. Results indicated that maize yields were highest following cover crops, with significant improvements in agronomic parameters. The study also evaluated N sufficiency indicators, providing insights into nitrogen loss and nutrient use efficiency in maize production systems.

Impact of Cover Crops and Nitrogen Fertilizer on Inbred Maize Yields in Southern Semi-Arid Puerto Rico
E N D
Presentation Transcript
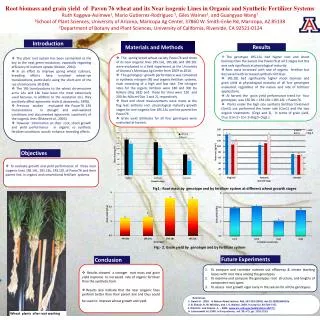
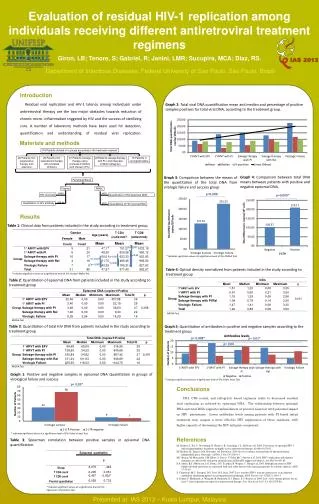
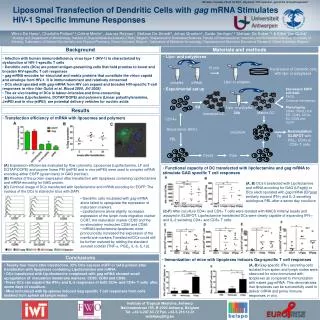
Inbred maize response to cover crops and fertilizer-N in the southern semi-arid coast of Puerto Rico David Sotomayor-Ramirez*1, Randy Huckaba2, Ricky Barnes2, Ronald Dorcinvil3, Jesus Espinosa1 1 College of Agricultural Sciences, University of Puerto Rico, Mayagüez 2 Dow AgroSciences LLC, Mycogen Seeds, Puerto Rico 3 North Dakota State University *Contact author: david.sotomayor@upr.edu This research was supported by the Univ of Puerto Rico, Agricultural Experiment Station and Dow AgroSciences LLC ASA-CCSA-SSSA Annual Meeting, 2011 Poster # 310 • OBJECTIVES • Determine optimum inbred maize seed yield response to antecedent cover crop and fertilizer-N addition • Assess the effectiveness of agronomic predictors of crop nitrogen (N) sufficiency status • Estimate potential N losses in the inbred maize production systems RESULTS AND DISCUSSION Table 1. ANOVA summary to examine treatment effects on yields and selected agronomic parameters of inbred maize during 2008-2009 (Trial 1). Table 2. Effect of fertilizer N on selected agronomic parameters of inbred maize during 2008-2009 (Trial 1). Means with different letters are significantly different (P<0.05). • MATERIALS AND METHODS • Location was Mycogen Seeds Corp. research farm in Santa Isabel, Puerto Rico. • Soil series are Jacaguas (Loamy-skeletal, mixed, superactive, isohyperthermic Fluventic Haplustolls) and Fraternidad (Fine smectitic, isohyperthermic Typic Haplusterts) • Trial 1: Effects of two cover crops and five fertilizer-N levels on maize seed yield response (2008-2009) • Experimental design was a split-plot arrangement of a RCBD with previous cover crop as the main plot and N level as sub-plot, with four replicates. • Cover crop treatments of: fallow, velvetbean (Mucuna prurience) or cowpea (Vigna unguiculata var Iron Clay), summer-fall 2008. • After 140 days of growth, cover crops were sprayed with glyphosate and incorporated via disking into the soil in late September 2008. • Fertilizer-N levels of: 0, 112, 150, 186, and 228 kg N/ha; 50 kg N/ha pre-plant and the remainder applied via fertigation, fall-winter 2008-2009. • All subplots received 67, 112, and 28 kg/ha of P2O5, K2O and ME (minor element mixture), respectively. • Inbred maize line A1was sown on 10 December 2008, grown to maturity and harvested at about 91 DAP. • Trial 2: Effect of five fertilizer-N levels on maize seed yield (2009-2010) • Experimental design was a RCBD with five treatments (N levels) and four replications. • Previous cropping was maize. • Fertilizer-N levels of: 0, 84, 125, 168, 211 kg N/ha; 28 kg N/ha pre-plant and the remainder applied via fertigation, winter 2010. • Inbred maize line B1was sown on February 2010, grown to maturity and harvested at about 91 DAP. • All plots received 63, 14, and 26 kg/ha of P2O5, K2O and ME (minor element mixture), respectively. • 1 - The inbred code is propietary information of Dow Agrosciences LLC • Irrigation was applied via drip irrigation following farm recommendations. • Soil preparation prior to maize planting included chisel plowing and disking. • Agronomic data gathered included: indicator leaf N concentration, SPAD chlorophyll meter (Minolta Corp.), plant height, leaf area index, and leaf color index (color chart with scale of 1 to 4). • Nutrient use efficiency indicators [difference method (DM)] • AEY-DM = (YGf – YGu)/Na • AEBY-DM = (BYf – BYu)/Na • ARE-DM = (NBYf – NBYu)/Na • Where AE is the Agronomic Efficiency; ARE is the Apparent Recovery Efficiency; Na is the fertilizer-N applied; YGf and YGu is the grain yield in fertilized and unfertilized crop, respectively; BYf and Byu is the biomass in fertilized and unfertilized crop, respectively; NBYf , and NBYu are the whole plant biomass N in fertilized and unfertilized plants, respectively. • Nutrient use efficiency indicators [balance method (BM)] • PFP-BM = YGf/Na • PBP-BM = NGf/ Na • AE = NBYf /Na • Where PFP is the Partial Factor Productivity; PBP is the Partial Balance Productivity; AE is the Agronomic Efficiency; NGf is the grain N uptake in fertilized crop. Figure 1:Scatter plots of the effect of fertilizer-N on N sufficiency indicators for inbred maize during 2008-2009 (Trial 1). • Trial 1 • Maize yields (kg/ha) were highest following velvet bean (2,903) and cowpea (2,522) and the latter was similar to fallow (2189). In general, the cover crops positively influenced the agronomic indicators. • Seed yield in the fertilizer-N range of 112 to 224 kg N/ha was 34% higher than unfertilized maize. • No significant difference was observed among fertilizer-N levels in the range of 112 to 224 kg/ha for stover weight, harvest index, plant biomass, stover N, grain N uptake, crop N uptake, and these were higher than the control (no fertilizer-N). • The SPAD chlorophyll meter, leaf color index and leaf area index were suitable indicators of N sufficiency. Table 4. Treatment means of selected N indicator parameters of inbred maize during 2009-2010. Means with different letters are significantly different (P<0.05) (Trial 2). Table 3. ANOVA summary to examine the effect of fertilizer N levels on yields and selected agronomic parameters of inbred maize during 2009-2010 (Trial 2) Table 5. Treatment means of selected N use efficiency indicator parameters of inbred maize during 2008-2009 and 2009-2010. Means with different letters are significantly different (P<0.05). • Trial 2 • Seed yield in the fertilizer-N range of 84 to 211 kg N/ha was 18% higher than unfertilized maize. • No significant treatment effects were observed for most agronomic parameters (marked in red) • The SPAD chlorophyll reading at R1 growth-stage adequately separated out the control (mean of 49.0) from the fertilized plots (mean of 51.1). • The leaf color index taken at both V5 and R1 growth-stage significantly identified treatment differences between the control and the fertilized plots. Figure 2. Nitrogen budget for 2008-2009, Trial 1 Explanation of terms Crop = grain N + stover N Immediate residual = crop N - fertilizer N Potential residual 1 = crop N - (fertilizer N + stover N) Potential residual 2 = crop N - (fertilizer N + stover N + soil N supply (estimated from crop N uptake) • N budget • Higher nutrient uptake in Trial 1 than Trial 2 • Crop N uptake was low, with grain N about 30% of that in crop. • Immediate residual N, is the fertilizer-N not taken up by the crop, and is that which remains in soil after harvest. • Potential residual N 1, is the immediate residual N plus that from stover N mineralization. • Potential residual N 2, is the excess N in soil considering stover N mineralization, soil profile N, and soil N mineralization. • Excess N increases with higher fertilizer-N. • CONCLUSIONS • Optimum crop response at fertilizer-N between 88 and 112 kg N/ha. • Further refinement of these values should be done using varying genetic materials (possibly classified as low- , medium-, and high-yielders). • N-use efficiency and N balance data shows: • Low fertilizer-N use efficiency, and harvest index • Crop N extraction (63 to 75 kg/ha and 110 to 156 kg/ha) • High immediate and potential residual soil N that increases beyond critical fertilizer-N rate • Can use agronomic plant sufficiency diagnostic tools such as plant height, indicator leaf N concentration, leaf color, SPAD chlorophyll index, possibly pre-plant soil nitrate