Download
1 / 18
180 likes | 265 Views
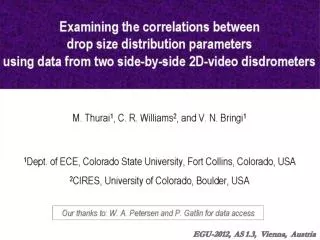
This study aims to investigate the correlations between measurements using 1-minute pair samples to determine if there is a correlation between Dm and σM as well as between μ and Λ. By analyzing same DSDs (co-relate) and comparing one against the other (cross-relate), this research explores biases in Dm, σM, μ, and Λ in SN16 and SN25 datasets. Significant biases in μ impact FSE comparisons, highlighting the need to mitigate biases for accurate comparisons. With 38 events to assess instrument-to-instrument variability, this study provides insights into data analysis.

E N D
For (1), is there a Dm - M correlation ? For (2), is there a - correlation ? Can address these questions using the 1-min pair samples: (a) ‘co-relate’ (same DSDs) (b) ‘cross-relate’ (one against the other)
No bias in Dm No bias in M
SN16 – SN16 M SN25 – SN16 SN16 – SN25 SN25 – SN25 M
Power-law fitted line Same line
shows bias SN25 data : more small drops
Significant bias in → so difficult to compare FSE values Remove mean bias and re-compare ……