Download
1 / 1
10 likes | 147 Views
Cluster-Based Modeling: Exploring the Linear Regression Model Space Student: XiaYi(Sandy) Shen Advisor: Rebecca Nugent Carnegie Mellon University, Pittsburgh, Pennsylvania . Issues with current model search criterions. Boston Housing Data. Introduction. Simulation with 60 Data Points.

E N D
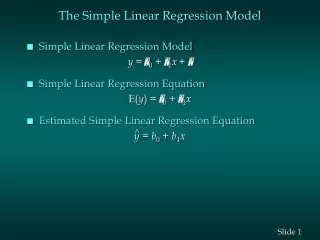
Cluster-Based Modeling:Exploring the Linear Regression Model Space Student: XiaYi(Sandy) Shen Advisor: Rebecca Nugent Carnegie Mellon University, Pittsburgh, Pennsylvania Issues with current model search criterions Boston Housing Data Introduction Simulation with 60 Data Points • Stepwise regression is greedy, does not necessarily search the entire model space • Could have very complicated models that do not predict much better than simpler models • Characterizing the models: • Represent each model by its nx1vector of fitted values • Models that predict similar values are close (in space) • We look at the Linear RegressionModel Space : • 2p-1 possible models, each with n fitted values • 2p-1 observations in n-dimensional space • Our questions: • Do models cluster? • Are there distinct “groups” of models with similar predictability? • Are there complicated models that could be replaced • by simpler models? • How is stepwise doing? • What is Linear Regression? • We have six predictor variables Xi1, Xi2, Xi3, Xi4, Xi5, Xi6 , i = 1,2,…,60 • Perfect model: Yi* = 2Xi1 + 3Xi2 • Real Y data: Yi = 2Xi1 + 3Xi2 + rnorm(60,0,1) • We have 26 = 64 possible models, model space is 64x60 dimensions • Visualization of Model Space: • We use a heat map of the kernel density estimate of the model space (red-low density, white/yellow-high density) • Perfect model in green, stepwise chosen models in blue, model with the right variables in red • Pairs plot : plots, impossible to show all in one graph, instead we show two selected pairs of dimensions representing two cross sections of the model space • Predicting the median value of owner-occupied homes in $1000 for 506 suburbs of Boston • Selected predictor variables: crime rate, average # of rooms, distance to employment centers, proportion of blacks, accessibility to highways, and nitrogen oxides concentration • Principal Component (PC) Projection: We randomly sampled 60 suburbs, since more models than observations are needed to run PC • Regression Model i = 1,2,…,n observations j = 0,1,2,…,p-1; p = number of parameters; p-1 variables β0 : E[Yi] when all Xi,j = 0 βj : Change in E[Yi] for one unit increase in Xi,j (all other variables fixed) • Estimated Regression Function where found by method of least squares • What does it look like graphically? • Hierarchical Clustering: Truth model: • Hierarchical Clustering is done on the PC projections • The stepwise chosen model is labeled in blue • Each model is labeled by its number of variables Illustration of Idea We have two predictor variables Xi1, Xi2, i = 1,2,3 : Perfect model: Yi*= 3 + 2Xi1 Real Y data: Yi = 3 + 2Xi1+ rnorm(3,0,1) (recall 4 possible models from previous panel) The fitted value from each model and the original Yi* are plotted below: Fitted model (red line): • Stepwise chose the model with variables X1, X2 and X3 • Two clusters of models, one group of models predicts similarly to the truth, the other group does not • The perfect model, the stepwise chosen model and the model with the right variables predict very similarly Note: Hard to look at higher dimensions, can only visualize 2-dimension at a time. • Principal Components (PC) projection: lower dimension representation which contain information/structure from the high dimensions How do we normally build/choose model? • In Practice, we have: • One variable that we are interested in predicting: Y • Many possible predictor variables: X1, X2 , X3 …… • There are two large clusters of models; each could be split into two smaller clusters • The stepwise chosen model predicts similarly to models with more variables; there is one 3-variable model that could be a possible replacement • Models with fewer variables are in the same cluster with a few exceptions • The model with no variables is similar to a 1-variable model • To predict Y from p-1 possible Xj variables • We have 2p-1 possible models • Example: 2 variables: X1, X2 => 4 possible models : • Y = β0 • Y = β0 + β1X1 • Y = β0 + β2X2 • Y = β0 + β1X1 +β2X2 Conclusion /Discussion • Stepwise regression models are in high frequency areas of the model space. In our simulations, it predicts similarly to the perfect model and the model with correct variables • PC projection is more useful to visualize higher dimension • Increasing the number of observations increases the dimensions; • Increasing the number of variables drastically increases the number of models • Future: Want to better characterize the clusters/model spaces • Model Criterion: R2, adjusted R2 , AIC, BIC, and Stepwise regression • Stepwise regression: search in the “model space” for the “best subsets” • Forward: adding in variables one at a time • Backward: removing variables one at a time • Both: alternates forward and backward steps • The blue and red models predict more similar values and are closer to the perfect fit (brown) in model space • The blue and red models contain the correct predictor variable X1 • The black model does not contain any predictor variable and thus is the furthest from the perfect fit • Three clusters of models, one group of models predicts closely to the truth, the other two groups do not. • Stepwise behaves similarly in PC projection as in pairs plot Note: relying on projection, hence does not necessarily capture all the structure/information } greedy algorithms