Download
1 / 46
460 likes | 535 Views
Study Results Wyoming Firmed Resource Option.

E N D
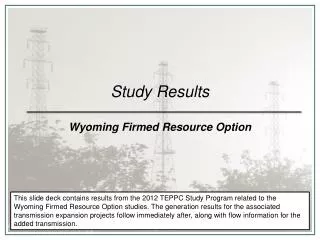
Study ResultsWyoming Firmed Resource Option This slide deck contains results from the 2012 TEPPC Study Program related to the Wyoming Firmed Resource Option studies. The generation results for the associated transmission expansion projects follow immediately after, along with flow information for the added transmission.
Gas Firming Modeling Goal Allow incremental gas CT’s (located in WY) to dispatch based on economics. Using a nomogram, force their output down DC lines (with wind). • Implementation Steps • Start with 2022 PC21 Wyoming Resource Option (+12,000 GWh) • Add 1,000 MW of incremental gas CC’s physically located in WY • Economic dispatch based on where DC line terminates • Standard “CC Recent” modeling • Remove CT’s no longer needed for PRM • PRM may have been supplemented by added CC’s • Remove CT’s from region where DC line terminates • Essentially assume DC line assures delivery • Use nomogram to force both wind and CC dispatch down DC line • DC Line Flow ≥ Added Wind + Added CTs
Renewable Options Under High Load • Firmed Cases Increase WECC-wide load 8% 1 Hydro Add: 12,000 GWh to meet WECC RPS Gas 2 3 Add: firming resource 4 Pumped storage Add transmission For these regions
Increase WECC-wide load 8% 1 8% 8% increase to peak and energy 10% 10% decrease to energy Higher Load = Additional RPS Energy
Add 12,000 GWh to meet WECC RPS 2 Extrapolation Method
10-Year Study ResultsWyoming Firmed Resource Option StudiesEC26-1 TransWest ExpressEC26-2 Zephyr AEC26-3 Zephyr BEC26-4 Zephyr CEC26-5 Zephyr D Zephyr D Zephyr A Zephyr B TransWest Express Zephyr C
AZ, NV, CA, CO Production cost decreased $21 M (.1%) Dump energy increased 9.6 GWh (2.6%) Emergency Energy decreased .4% CO2 Emissions decreased .1%
NV, CA, CO Production cost decreased $426 M (2.4%) Dump energy increased 54.1 GWh (16.2%) Emergency Energy decreased .6% CO2 Emissions decreased 1.3%
What is different? Loads Transmission Resources
What is different? Loads Transmission Resources
10-Year Study ResultsWyoming Firmed Resource Option StudiesEC26-1 TransWest ExpressEC26-2 Zephyr AEC26-3 Zephyr BEC26-4 Zephyr CEC26-5 Zephyr D Zephyr D Zephyr A Zephyr B TransWest Express Zephyr C
WY Production cost decreased $160 M (.9%) Dump energy increased 121GWh (33%) Emergency Energy decreased .6% CO2 Emissions decreased 0%
WY AZ, NV, CA, WA Production cost decreased $244M (1.4%) Dump energy increased 153 GWh (46.2%) Emergency Energy increased .4% CO2 Emissions decreased 1.4%
What is different? Loads Transmission Resources
What is different? Loads Transmission Resources
10-Year Study ResultsWyoming Firmed Resource Option StudiesEC26-1 TransWest ExpressEC26-2 Zephyr AEC26-3 Zephyr BEC26-4 Zephyr CEC26-5 Zephyr D Zephyr D Zephyr A Zephyr B TransWest Express Zephyr C
WY AZ, NV, CA Production cost decreased $150M (2.4%) Dump energy increased 138 GWh (38%) Emergency Energy increased .4% CO2 Emissions decreased .1%
WY AZ, NV, CA, WA Production cost decreased $254M (1.4%) Dump energy increased 170 GWh (51%) Emergency Energy decreased .1% CO2 Emissions decreased 1.3%
What is different? Loads Transmission Resources
What is different? Loads Transmission Resources
10-Year Study ResultsWyoming Firmed Resource Option StudiesEC26-1 TransWest ExpressEC26-2 Zephyr AEC26-3 Zephyr BEC26-4 Zephyr CEC26-5 Zephyr D Zephyr D Zephyr A Zephyr B TransWest Express Zephyr C
WY AZ, NV, CA, WA Production cost decreased $118 M (.7%) Dump energy increased 124 GWh (34%) Emergency Energy decreased 0% CO2 Emissions decreased 0%
WY AZ, NV, CA, WA Production cost decreased $286M (1.6%) Dump energy increased 156 GWh (47%) Emergency Energy decreased .2% CO2 Emissions decreased 1.3%
What is different? Loads Transmission Resources
What is different? Loads Transmission Resources
10-Year Study ResultsWyoming Firmed Resource Option StudiesEC26-1 TransWest ExpressEC26-2 Zephyr AEC26-3 Zephyr BEC26-4 Zephyr CEC26-5 Zephyr D Zephyr D Zephyr A Zephyr B TransWest Express Zephyr C
WY Production cost decreased $472M (2.7%) Dump energy increased 78 GWh (21%) Emergency Energy increased .9% CO2 Emissions decreased 1.6%
WY Production cost decreased $68M (.3%) Dump energy increased 110GWh (33%) Emergency Energy increased .7% CO2 Emissions decreased 3%
What is different? Loads Transmission Resources
What is different? Loads Transmission Resources