Download
1 / 43
430 likes | 536 Views
Study Results Basin Resource Option SSPG East SSPG North SSPG South.

E N D
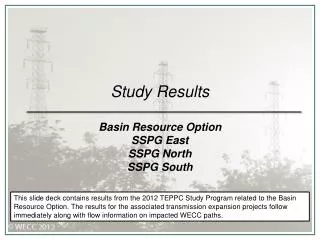
Study ResultsBasin Resource OptionSSPG East SSPG NorthSSPG South This slide deck contains results from the 2012 TEPPC Study Program related to the Basin Resource Option. The results for the associated transmission expansion projects follow immediately along with flow information on impacted WECC paths.
Study Concept Starting case: 2022 High Load (PC1-5) Increase WECC annual energy demand 8% Results in additional 12,000 GWh of RPS resource requirements (per statutes) Model added 12,000 GWh in regions throughout WECC (w/ transmission) Goal Compare different resource and transmission options Total (capital and production) cost comparisons Will be shown at a later date Renewable Options Under High Load CaseThe Basics
Renewable Options Under High Load Cases Increase WECC-wide load 8% 1 Add: 12,000 GWh to meet WECC RPS 2 3 Add transmission For these regions
Increase WECC-wide load 8% 1 8% 8% increase to peak and energy 10% 10% decrease to energy Higher Load = Additional RPS Energy
Add 12,000 GWh to meet WECC RPS 2 Extrapolation Method
Resource Option StudiesBreakdown of Incremental 12,000 GWh Wind Solar PV Solar Thermal Small Hydro Geothermal Biomass RPS
1- Check PRM 2 - Add CTs (if needed) = Higher load and new resources
PC1-5 High Load PRM Gap 1) Added CTs in 100 MW increments to make up this 11,426 MW PRM Gap 2) CT’s were adjusted in Renewable Options Under High Load studies
3 fewer CTs needed in Basin This makes sense: 3,000 MW wind × 10% = 300 MW to peak = 3 fewer CTs
3 Add transmission • Transmission Expansion Projects Path 8 Upgrade MSTI + SWIP N Selkirk – Bell – Ashe Nicola – Chief Joe Selkirk – Ashe DC Selkirk – Buckley DC WY-CO Intertie TransWest Express Zephyr A /B/C/D High Plains Express SSPG East SSPG North SSPG South High Plains Express None Centennial West
Now to the results… • Resource assumption overview • Portfolio Case generation results (versus PC1-5 High Load) • Transmission projects overview • Expansion case generation results (versus PC1-5 High Load and Portfolio Case) • Path flow results - Reviewed duration plots for key WECC paths.
BasinResource Assumptions + 531 + 27 + 136 + 11 + 207 + 1136 + 455 + 90 + 272 Wind Solar PV Solar Thermal Small Hydro Geothermal Biomass RPS
Production cost decreased $355 M (-2%) Dump energy increased 90 GWh (27%) Emergency Energy increased.3% CO2 Emissions decreased 1%
What is different? Loads Transmission Resources
10-Year Study ResultsPC24 Basin Resource OptionEC24-1 SSPG EastEC24-2 SSPG NorthEC24-3 SSPG South SSPG North SSPG East SSPG South
E-W • Single-circuit 345 kV from IPP (UT) to Robinson Summit (NV) • Generator collector system did not fit with TEPPC’s modeled resources so this portion was excluded
Production cost decreased $369 M (-2%) Dump energy increased 66 GWh (20%) Emergency Energy decreased .5% CO2 Emissions decreased 1% CA, NV
UT CA, NV UT Production cost decreased $14M (-0%) Dump energy decreased 23 GWh (5%) Emergency Energy decreased .3% CO2 Emissions did not change A little more biomass dispatch
What is different? Loads Transmission Resources
10-Year Study ResultsPC24 Basin Resource OptionEC24-1 SSPG EastEC24-2 SSPG NorthEC24-3 SSPG South SSPG North SSPG East SSPG South
East to West East to West Orena – San Emido 345-kV single circuit San Emido – Viewland 345-kV single circuit Viewland – Westwood 230-kV double circuit Westwood – Olinda 230-kV single circuit 230 345 + 531
Production cost decreased $355M (-2%) Dump energy increased 82 GWh (24%) Emergency Energy decreased .5% CO2 Emissions decreased 1% CA, NV Added Basin Renewables
Production cost did not change much Dump energy decreased 7 GWh (1.6%) Emergency Energy decreased .2% CO2 Emissions did not change Note the small scale of the changes
What is different? Loads Transmission Resources
10-Year Study ResultsPC24 Basin Resource OptionEC24-1 SSPG EastEC24-2 SSPG NorthEC24-3 SSPG South SSPG North SSPG East SSPG South
+ 455 230 • Single-circuit 500 kV from new substation in NV (Esmeralda) to Antelope. • Generator collector system did not fit with TEPPC’s modeled resources so this portion was excluded 500
Production cost decreased $363M (-2%) Dump energy increased 13 GWh (4%) Emergency Energy decreased.3% CO2 Emissions decreased 1% CA, UT, NV Added Basin Renewables
Note the small scale of the changes Production cost did not change Dump energy decreased 76 GWh (18%) Emergency Energy decreased 0% CO2 Emissions did not change
What is different? Loads Transmission Resources