Download
1 / 34
360 likes | 681 Views
Discrete Probability Distributions. Chapter 5 MSIS 111 Prof. Nick Dedeke. Learning Objectives. Distinguish between discrete random variables and continuous random variables. Learn how to determine the mean and variance of a discrete distribution.

E N D
Discrete Probability Distributions Chapter 5 MSIS 111 Prof. Nick Dedeke
Learning Objectives • Distinguish between discrete random variables and continuous random variables. • Learn how to determine the mean and variance of a discrete distribution. • Identify the type of statistical experiments that can be described by the binomial distribution, and learn how to work such problems.
Learning Objectives -- Continued • Decide when to use the Poisson distribution in analyzing statistical experiments, and know how to work such problems. • Decide when binomial distribution problems can be approximated by the Poisson distribution, and know how to work such problems.
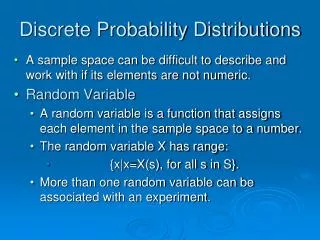
Random Variable • Random Variable -- a variable which associates a numerical value to the outcome of a chance experiment • Example:Random Variable Result of baseball gameOutcomes Values Win, Lose, Tie
Discrete vs. Continuous Distributions • Discrete Random Variable – arise from counting experiments. It has a finite number of possible values or an infinite number of possible values that can be arranged in sequence • Number of new subscribers to a magazine • Number of bad checks received by a restaurant • Number of absent employees on a given day • Continuous Random Variable – arise from measuring experiments. It takes on values at every point over a given interval • Current annual income of motorcycle distributorships • Elapsed time between arrivals of bank customers • Percent of the labor force that is unemployed
Experiment • Experiment: We want to flip a coin twice. What are all the possible outcomes of the experiment?
Experiment • Experiment: We want to flip a coin twice. What are all the possibilities of the experiment? Outcomes possible: HH, HT, TH, TTTo assign numerical variables to the outcomes, we have to define the random variablesLet X be number of heads in the outcome Let Y be number of tails in the outcome
Deriving Discrete Distributions for Random Variable Experiments • Experiment: We want to flip a coin twice. What are all the possibilities of the experiment? Outcomes possible: HH, HT, TH, TTLet X be number of heads in outcome Let Y be number of tails in outcome Outcome values of Xvalues of Y HH 2 0 HT 1 1 TH 1 1 TT 0 2
Exercise: Deriving Discrete Distributions for Random Variable Experiments • Experiment: We want to flip a coin thrice. What are all the possibilities of the experiment? What are the random variables? Outcomes possible?:What are the values for the distributions if random variables are defined as follows?Let X be number of heads in outcome Let Y be number of tails in outcome
H H T H H T T H H T T H T T Tree diagram for Sample Spaces HHH HHT HTH HTT THH THT TTH TTT Number of elements in sample space 2n = 23 The number 2 came from the possible outcomes per toss (experiment)
Response: Deriving Random Variables • Experiment: We want to flip a coin thrice. What are all the possibilities of the experiment? Let X be number of heads in outcome Let Y be number of tails in outcome Outcomes values of X values of YHHH 3 0 HHT 2 1 HTH 2 1 HTT 1 2 THH 2 1 THT 1 2 TTH 1 2 TTT 0 3
Exercise: Deriving Discrete Probability Distribution • Experiment: We flip a coin thrice. What is the probability distribution for X random variable the experiment? Let X be the number of heads in outcome. What is the probability distribution for Y random variable? Outcome values of X values of YHHH 3 0 HHT 2 1 HTH 2 1 HTT 1 2 THH 2 1 THT 1 2 TTH 1 2 TTT 0 3 X Fi P(x) 0 1 0.125 1 3 0.375 2 3 0.375 3 1 0.125 8 1.00
Exercise: Deriving Discrete Probability Distribution • Experiment: Before we registered at a gym club, we investigated samples of members of the gym that had injured themselves The data is provided below. Let X be the number of muscle injuries in outcome. What is the probability distribution for X random variable for the experiment? Let Y be the number of bone injuries in outcome. What is the probability distribution for Y random variable? Samples values of X values of Y1st pool 4 0 2nd pool 2 1 3rd pool 4 1 4th pool 4 2 5th pool 3 1 6th pool 3 2 7th pool 1 2 8th pool 0 0
Response: Deriving Discrete Probability Distribution • Experiment: Before we registered at a gym club, we investigated samples of members of the gym that had injured themselves The data is provided below. Let X be the number of muscle injuries in outcome. What is the probability distribution for X random variable for the experiment? Let Y be the number of bone injuries in outcome. What is the probability distribution for Y random variable? Samples values of X values of Y1st pool 4 0 2nd pool 2 1 3rd pool 4 1 4th pool 4 2 5th pool 3 1 6th pool 3 2 7th pool 1 2 8th pool 0 0 • X Fi P(X) • 0 1 0.125 • 1 1 0.125 • 1 0.125 • 3 2 0.250 • 4 3 0.375 • 8 1.00 Y Fi P(Y) 0 2 0.25 1 3 0.375 2 3 0.375 8 1.00
Distribution of Daily Crises P r o b a b i l i t y 0.5 Number of Crises Probability 0.4 0 1 2 3 4 5 0.37 0.31 0.18 0.09 0.04 0.01 0.3 0.2 0.1 0 0 1 2 3 4 5 Number of Crises Example: Discrete Distributions & Graphs
Requirements for a Discrete Probability Functions • Probabilities are between 0 and 1, inclusively • Total of all probabilities equals 1
X P(X) X P(X) X P(X) -1 0 1 2 3 .1 .2 .4 .2 .1 1.0 -1 0 1 2 3 -.1 .3 .4 .3 .1 1.0 -1 0 1 2 3 .1 .3 .4 .3 .1 1.2 Do Any of these Distributions meet the Requirements for Discrete Probability Functions? PROBABILITY DISTRIBUTION
X P(X) X P(X) X P(X) -1 0 1 2 3 .1 .2 .4 .2 .1 1.0 -1 0 1 2 3 -.1 .3 .4 .3 .1 1.0 -1 0 1 2 3 .1 .3 .4 .3 .1 1.2 Do Any of these Distributions meet the Requirements for Discrete Probability Functions? : YES NO NO PROBABILITY DISTRIBUTION
X P ( X ) X P(X) -1 0 1 2 3 .1 .2 .4 .2 .1 -.1 .0 .4 .4 .3 1.0 Example: Mean of a Discrete Distribution = 1.0
X X P(X) -1 0 1 2 3 .1 .2 .4 .2 .1 -2 -1 0 1 2 4 1 0 1 4 .4 .2 .0 .2 .4 1.2 Variance and Standard Deviation of a Discrete Distribution
X P(X) X P(X) P r o b a b i l i t y 0.5 0 .37 .00 0.4 1 .31 .31 0.3 2 .18 .36 0.2 3 .09 .27 0.1 4 .04 .16 0 0 1 2 3 4 5 5 .01 .05 Number of Crises 1.15 Example: Mean of the Crises Data
Example: Variance and Standard Deviation of Crises Data X P(X) (X- ) (X- ) 2 (X- ) 2 P(X) 0 .37 -1.15 1.32 .49 1 .31 -0.15 0.02 .01 2 .18 0.85 0.72 .13 3 .09 1.85 3.42 .31 4 .04 2.85 8.12 .32 5 .01 3.85 14.82 .15 1.41
Exercise: Deriving Discrete Probability Distribution • Experiment: We investigated the number of people in two gyms who have injured themselves. The data is provided below. What is the probability distribution for X1 and X2 random variables for the experiment? What is the mean and standard deviations for each gym? What is the probability that equal to or greater than 3 injuries occur in each gym? Let X1 and X2 be the random variables for the number of injuries in outcome. • X1 • 4 • 2 • 4 • 3 • 3 • 1 • 0 • X2 • 4 • 2 • 3 • 3 • 2 • 2 • 1
Exercise: Deriving Discrete Probability Distribution • Experiment: We investigate the number of people in two gyms that injured themselves. The data is provided below. What is the probability distribution for X random variable for each experiment? What is the mean and standard deviations for each gym? What is the probability that equal to or greater than 3 injuries occur in each gym? Let X be the number of injuries in outcome. • X1 Fi P(x1) • 0 1 0.125 • 1 1 0.125 • 1 0.125 • 3 2 0.250 • 4 3 0.375 • 8 1.00 • X1 • 4 • 2 • 4 • 3 • 3 • 1 • 0 • X2 • 4 • 2 • 3 • 3 • 2 • 2 • 1 • X2 Fi P(x2) • 1 1 0.125 • 3 0.375 • 2 0.250 • 4 2 0.250 • 8 1.00
Response: Deriving Discrete Probability Distribution (Gym I) • What is the mean and standard deviations for each gym? What is the probability that equal to or greater than 3 injuries occur in each gym? Let X1 be the number of injuries in outcome. • X1 Fi P(x1) X*P(x1) • 0 1 0.125 0 -2.625 6.8906 0.86125 • 1 1 0.125 0.125 -1.625 2.6406 0.330 • 1 0.125 0.250 -0.625 0.3906 0.0488 • 3 2 0.250 0.750 0.375 0.1406 0.0351 • 4 3 0.375 1.50 1.375 1.8906 0.07089 • 8 1.00 2.625 11.953 1.9842 Standard deviation = σ = 1.984 = 1.408 injuries P(X1<=2) = P(X1=0)+ P(X1=1)+ P(X1=2)=0.125+0.125+0.125= 0.375 P(X1 >=3) = 1 - P(X1<=2) = 1 –0.375 = 0.625
Response: Deriving Discrete Probability Distribution (Gym II) • What is the mean and standard deviations for each gym? What is the probability that equal to or greater than 3 injuries occur in each gym? Let X be the number of injuries in outcome. X2 Fi P(x2) X*P(x2) (X2-μ) )(X2-μ)2 1 1 0.125 0.125 -1.625 2.6406 0.330 2 3 0.375 0.750 -0.625 0.3906 0.1464 3 2 0.250 0.750 0.375 0.1406 0.0351 4 2 0.250 1.00 1.375 1.8906 0.4726 8 1.00 2.625 11.953 0.9842 P(x2)(X2-μ)2 Standard deviation = σ = 0.9842 = 0.9921 injuries P(X1<=2) = P(X1=1)+ P(X1=2)= 0.125+0.375 P(X1 >=3) = 1 - P(X1<=2) = 1 –0.5 = 0.5
Response: Choice between Two Gyms – Use of Discrete Probability Distribution • We should select Gym II because it has lower probability of yielding high injuries. Gym I Mean = σ = 2.625 injuries Standard deviation = σ = 1.408 injuries Probability of 3 or higher injuries = 1 - P(X1<=2) = 1 –0.5 = 0.625 Gym II Mean = σ = 2.625 injuries Standard deviation = σ = 0.9921 injuries Probability of 3 or higher injuries = 1 - P(X1<=2) = 1 –0.5 = 0.5
Exercise: Deriving Discrete Probability • For the data below, find the following probabilities: • What is the probability that greater than 3 injuries occur in the gym? • What is the probability that less than 2 injuries occur in the gym? • What is the probability that greater than or equal to 2 but less than 4 injuries occur in the gym? Let X1 be the number of injuries in outcome. • X1 Fi P(x1) X*P(x1) • 0 1 0.125 0 -2.625 6.8906 0.86125 • 1 1 0.125 0.125 -1.625 2.6406 0.330 • 1 0.125 0.250 -0.625 0.3906 0.0488 • 3 2 0.250 0.750 0.375 0.1406 0.0351 • 4 3 0.375 1.50 1.375 1.8906 0.07089 • 8 1.00 2.625 11.953 1.9842
Response: Deriving Discrete Probability • For the data below, find the following probabilities: • What is the probability that greater than 3 injuries occur in the gym? • What is the probability that less than 2 injuries occur in the gym? • What is the probability that greater than or equal to 2 but less than 4 injuries occur in the gym? Let X1 be the number of injuries in outcome. • X1 Fi P(x1) X*P(x1) • 0 1 0.125 0 -2.625 6.8906 0.86125 • 1 1 0.125 0.125 -1.625 2.6406 0.330 • 1 0.125 0.250 -0.625 0.3906 0.0488 • 3 2 0.250 0.750 0.375 0.1406 0.0351 • 4 3 0.375 1.50 1.375 1.8906 0.07089 • 8 1.00 2.625 11.953 1.9842 P(X1>3) = P(X1=4) = 0.375 P(X1<2) = P(X1=0)+ P(X1=1) = 0.125+0.125 = 0.25 P(2=<X1<4) = P(X1=2)+ P(X1=3)=0.125+0.25 = 0.375
Casino Case • There are two casinos that we could play at in the coming months. Design an experiment that should be used to compare the two locations. We want to be able to make the most money. Create a sample table using fictitious data to show how you will make a decision. We would choose one location. Work in groups and prepare a submission.
Illustration of Casino problem Calculate arithmetical average for each casino. X the random variable, is defined as wins greater than $50,000 in the table shown above.Which casino should we choose? What happens if random variable X is defined as wins greater than $200,000?
Use of Tables • In the exercises that we have done, we assumed that the person doing the decision making had to conduct experiments on gym members. This is because, she does not know ahead of hand, the probability distribution of the experiment. If she knew this, she would not need to do experiments, she would just pick the appropriate probability distributions and do the calculations.
Examples of standard: Discrete and Continuous Probability Distributions • Discrete • Binomial distributions • Poisson distributions • Continuous • Uniform distributions • normal distributions • exponential distributions • T distributions • chi-square distributions • F distributions