Download
1 / 23
230 likes | 323 Views
Explore the impact of innovative transport technologies on sustainable infrastructure. Discussing the National Infrastructure Plan (NIP) and strategies to enhance transport networks for a low-carbon economy.

E N D
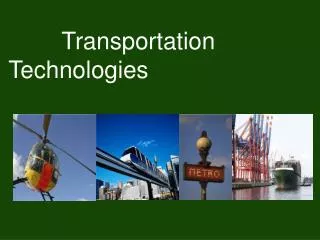
ReVISIONS Regional Visions of Integrated Sustainable Infrastructure Optimised for Neighbourhoods Alternative transportation technologies compared John D Nelson ReVISIONS Annual Symposium June 2012, Sao Paulo
Overview Context of this study Transport Technology Policy: The National Infrastructure Plan Transport technologies for supply-side measures within ReVISIONS Concluding remarks ReVISIONS Regional Visions of Integrated Sustainable Infrastructure Optimised for Neighbourhoods
Transport context Transport is a key determinant of people’s travel choices and “costs” of travel, and hence influences the location of households and firms as well as energy demands. This in turn influences infrastructure requirements The ReVISIONS project is testing combinations of future spatial options and transport policies, including priorities for infrastructure investment ReVISIONS has found, like the NIP, that new technologies would be needed to provide more substantial benefits.
Technology context Technology is a key determinant of future transport policy Over the next 25 years: what technology is inevitable, very likely or a far off vision? Is the technology likely to have significant impacts on travel behaviour or on network conditions when aggregated to the regional level? Is the technology likely to have significant impacts on sustainability? Is the technology likely to have significant impacts on other sectors (e.g. demands for energy or health impacts etc.)?
Digital Economy • Digital Economy • is the novel design or use of information and communication technologies to help transform the lives of individuals, society or business • RCUK Digital Economy Programme • EPSRC (lead Council), AHRC and ESRC • Transport is a priority theme • http://www.rcukdigitaleconomy.org.uk/
The National Infrastructure Plan “Britain will not be able to compete in the modern world unless we improve our infrastructure. Our transport systems are congested. Many of our older and more polluting power stations will come to the end of their lives over the next decade. Increases in population will put more pressure on our water supplies and advances in technology will increase demand for digital connectivity.” http://www.hm-treasury.gov.uk/national_infrastructure_plan2011.htm
The NIP Strategy The NIP sets out a new strategy for meeting the infrastructure needs of the UK economy. There are three elements to this strategy. A plan for the medium term and across sectors. The Plan brings together the first ever comprehensive cross-sectoral analysis of the UK’s infrastructure networks and sets out a clear pipeline of over 500 infrastructure projects. Mobilisation of the finance required to deliver these projects. The Plan sets out a new approach to co-ordinating public and private investment in UK infrastructure. Public capital investment is prioritised towards infrastructure that supports growth. Private investment will finance the majority of the infrastructure by bringing in new investors; introducing new sources of revenue such as tolling; and allowing local authorities more flexibility in the way they use local receipts to fund major infrastructure in specific circumstances. The Government will take an active role in ensuring the infrastructure in the Plan is delivered efficiently and on time, with priority given to those projects most critical for economic growth. Government will play their part in tackling planning and regulatory delays and addressing key commercial and policy issues.
Transport and the NIP The vision for the future of the transport networks is: to keep Britain moving by improving the capacity, performance and resilience of roads, railways and international gateways, making smarter use of existing infrastructure and tackling performance problems. to improve integration between different modes of transport, improving people’s choice as to how they travel and facilitating movement of freight from road to rail and water where this is viable and appropriate; to support the move to a low carbon economy, reducing the environmental impacts of the transport system so that transport greenhouse gas emissions are falling, and supporting cost effective delivery of the UK’s carbon budgets; and to improve connectivity and capacity between main urban areas and between them and international gateways, to deal with longer term capacity constraints, by delivering a series of projects to enhance network capability, including reducing journey times and improving interchanges.
Transport Infrastructure / technologies in ReVISIONS Options include: Highway measures Bus based measures Rail based measures Vehicle and engine technologies General demand reduction
Modelling transporttechnologies For each technology the following characteristics will form a set of inputs to the ReVISIONS modelling framework: scale of introduction over time the cost of introduction (per unit or per km as appropriate) cost to user (per unit (e.g. purchase cost) or per km (e.g. operating cost) as appropriate) any impacts in terms of changes to travel times, congestion levels, speeds, carbon emissions etc. changes in capacity on the network.
Highway measures Technologies to increase road capacity through advanced traffic management and signalling systems Urban Traffic Control (UTC) Motorway hard shoulder running In-vehicle dynamic route guidance systems Autonomous vehicles
Traffic signalling/control New wireless vehicle-detection and communication systems provide a reliable, accurate and cost-effective alternative to inductive loop detectors Permits accurate vehicle detection to be deployed at a much higher density than has previously been possible. Several systems globally: SCOOT, SCATS, OPAC, RHODES, SPOTS/UTOPIA, PRODYN, MOTION SCOOT is most prevalent in UK on average reduces delays by approx 20% over typical fixed time system av reduction in journey time across the network of 8% Fuel saving potential ~ 20% A real-time traffic signal control system Source: various papers and websites A simplified diagram of the RHODES operation Source: Mirchandani and Lucas (2004)
Bus based measures Technologies to reduce bus wait times or increase bus speed Real-time bus information via mobile devices Bus priority systems Smart card payment
Real-time passenger information Real-time bus information (provided via mobile device) before arrival at the bus stop Time saving evidence: OneBus Away system, Seattle: 91% of users reported spending less time waiting Transit Tracker system, 95% of users stated system reduces their wait time Actual time savings depends on frequency (and reliability) of bus services Cost of introduction : costs in the order of £1,600 - £3,500 per bus at 2008 prices (Source - AECOM 2008) Britain has approximately 40,000 conventional buses in service. To equip all of these at £2000 per bus would cost £80m. Replacement needed every 5 years.
Smart cards A credit-card-sized piece of plastic which has a microchip with the ability to read and write data, and to store much more data all within an extremely secure environment. Or Near Field Communications (NFC) equippedphone Key benefits include: reduced boarding times + simple ticketing for passengers; improved public transport running times and fuel efficiency for operators 75% of passenger boarding time could be saved amounting to 15 seconds per stop. This equates to a total average journey time saving of 2 ½ minutes. Cost of introduction : Considerable start-up costs to rolling out national smart ticketing schemes on buses across England (£360m). The on-going costs are lower but also significant (£75m). National smart ticketing infrastructure Source: DfT and Detica (2009)
Rail based measures Measures to increase rail capacity Improvements to rail signalling systems CBTC ; ERTMS Measures to increase rail speed Rail electrification High speed commuter rail / Super Express trains
Rail electrification Approximately 33% of the British rail network is currently electrified Typically an electric train emits 20–35% less carbon per passenger mile than a diesel train. This advantage will increase over time as our power generation mix becomes less carbon intensive. + Regenerative braking enables many electric trains to re-use the energy that would otherwise have been lost when braking, by converting the energy of motion back into electricity Electric trains have zero emissions at the point of use Electric trains can provide additional carrying capacity compared to a diesel train of the same overall length. Diesel high-speed trains are unable to carry many people in the power cars at either end of the train. This is not the case for electric trains. In addition to the journey time savings, it is expected that the introduction of Super Express trains will provide at least 15% extra capacity on intercity services during the morning peak hour. Source: DfT (2009) Britain’s Transport Infrastructure Rail Electrification
Vehicle and engine technologies Petrol /diesel engine technology improvements Alternatively fuelled vehicles Electric vehicles
UK Scenarios King Review (2007): A mixture of fuels in 2030 (different fuels suit different uses) EV for short city journeys and PHEV/alternative fuels vehicles for long journeys BERR and DfT (2008): Forecast EV and PHEV market uptake up to 2030 Business as usual: 2010: 0.01% 2020: 1% 2030: 8% Extreme scenario: 2010: 0.01% 2020: 9% 2030: 59% EV energy use in kWh/km = 2010: 0.16; 2020: 0.13; 2030: 0.11 Emission factor well to wheel in gCO2e/km = EV ICE (petrol) ICE (diesel) 2010: 69 172 156 2020: 56 144 130 2030: 47 120 109
General Demand Reduction Measures Telecommuting: On its own transport substitution through the use of ICT will deliver only modest reductions in overall traffic levels for 3 basic reasons: Work-related trips are only around half of all trips by car UK figures show 83% of full-time employees currently consider it would not be possible for them to work at home (DfT, 2005). Even accounting for changing working practices in the future, probably only about 30-40% of work can effectively be done on a flexible location basis. It is likely that other trips will be generated. UK evidence has shown an apparent higher incidence of part-day homeworking compared to whole-day homeworking amongst full-time paid employees - the implication is that this could in future contribute to spreading of peak period traffic (Haddad, Lyons and Chatterjee, 2009) Homeworking clearly has potential, in principle, to make a modest contribution towards reducing the growth of peak time congestion. The potential for reducing carbon emissions is less clear. Source: various sources
Concluding remarks Technology is a key determinant of future transport policy but we must understand the drivers of travel demand What is the role of roads, railways and high speed broadband in promoting growth across regions and nations? How can we co-ordinate and plan public and private investment? How can any plan be delivered efficiently and on time?
Contact details Centre for Transport Research http://www.abdn.ac.uk/ctr RCUK dot.rural Digital Economy Research Hub http://www.dotrural.ac.uk Professor John D Nelson j.d.nelson@abdn.ac.uk Dr Steve Wright s.d.wright@abdn.ac.uk
Join the Digital EconomySustainable Society Network+ • Sustainable_society@cantab.net Water, waste, energy, local and national transport infrastructures…