Uniform
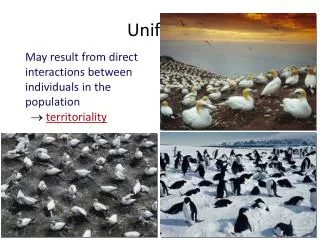
Uniform. May result from direct interactions between individuals in the population territoriality. Clumped patterns. Population Size. Changes to population size adding & removing individuals from a population birth death immigration emigration. Population growth rates.

Uniform
E N D
Presentation Transcript
Uniform May result from direct interactions between individuals in the population territoriality Clumped patterns
Population Size • Changes to population size • adding & removing individuals from a population • birth • death • immigration • emigration
Population growth rates • Factors affecting population growth rate • sex ratio • how many females vs. males? • generation time • at what age do females reproduce? • age structure • how females at reproductive age in cohort?
Demography Why do teenage boys pay high car insurance rates? • Factors that affect growth & decline of populations • vital statistics & how they change over time Life table females males What adaptations have led to this difference in male vs. femalemortality?
Survivorship curves • Graphic representation of life table The relatively straight lines of the plots indicate relatively constant rates of death; however, males have a lower survival rate overall than females. Belding ground squirrel
Age structure • Relative number of individuals of each age What do these data imply about population growth in these countries?
1000 Human (type I) Hydra (type II) 100 Survival per thousand Oyster (type III) 10 1 0 25 50 75 100 Percent of maximum life span Survivorship curves What do these graphs tell about survival & strategy of a species? • Generalized strategies I. High death rate in post-reproductive years II. Constant mortality rate throughout life span III. Very high early mortality but the few survivors then live long (stay reproductive)
Trade-offs: survival vs. reproduction • The cost of reproduction • increase reproduction may decrease survival • age at first reproduction • investment per offspring • number of reproductive cycles per lifetime Natural selection favors a life history that maximizes lifetime reproductive success
Parental survival Kestrel Falcons: The cost of larger broods to both male & female parents