Download
1 / 6
60 likes | 184 Views
Simulations and Visualizations of Hurricane Sandy (2012) as Revealed by the NASA Advanced Global Modeling and Visualization Systems Bo- Wen Shen (ESSIC/612), Jui -Lin F. Li, Samson Cheung, David Ellsworth and Wu-Ling Wu. 1200 UTC Oct 27 2012. 1200 UTC Oct 28 2012.

E N D
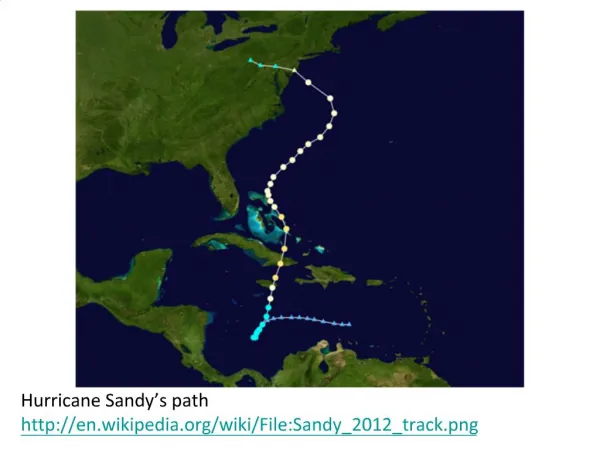
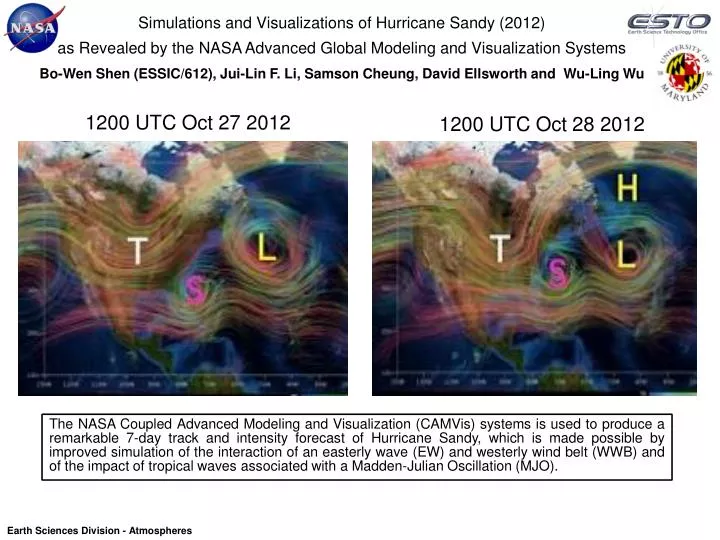
Simulations and Visualizations of Hurricane Sandy (2012) as Revealed by the NASA Advanced Global Modeling and Visualization Systems Bo-Wen Shen (ESSIC/612), Jui-Lin F. Li, Samson Cheung, David Ellsworth and Wu-Ling Wu 1200 UTC Oct 27 2012 1200 UTC Oct 28 2012 The NASA Coupled Advanced Modeling and Visualization (CAMVis) systems is used to produce a remarkable 7-day track and intensity forecast of Hurricane Sandy, which is made possible by improved simulation of the interaction of an easterly wave (EW) and westerly wind belt (WWB) and of the impact of tropical waves associated with a Madden-Julian Oscillation (MJO). Earth Sciences Division - Atmospheres
Name: Bo-Wen Shen, UMCP/ESSIC and NASA/GSFC, Code 612 E-mail: bo-wen.shen-1@nasa.gov Phone: 301-614-6251 References: Shen, B.-W., B. Nelson, W.-K. Tao, and Y.-L. Lin. 2013a. "Advanced Visualizations of Scale Interactions of Tropical Cyclone Formation and Tropical Waves." IEEE CiSE 15 (2): 47-59 [ 10.1109/MCSE.2012.64] Shen, B.-W., M. DeMaria, J.-L. Li, and S. Cheung. 2013b. "Genesis of Hurricane Sandy (2012) Simulated with a Global Mesoscale Model." Geophys. Res. Lett.40 4944-4950 [10.1002/grl.50934] Data Sources: TRMM precipitation and global model simulations Technical Description of Figures: Graphic:4-D visualizations of Hurricane Sandy consisting of temporal evolution of 3-D visualization at 1200 UTC Oct. 27 (a), and 1200 UTC Oct. 28 (b). During the period, Sandy (labeled in a pink “S”) moved northward under the influence of the sub-tropical middle- and upper-level trough (to Sandy’s northwest) and interacted with the trough that was deepening (not shown), increased its spatial extent (a), and encountered a high-and-low blocking pattern over the North Atlantic, which prevented Sandy from moving eastward further (b). At this time, the middle-latitude, upper-level trough (labeled in a white “T”) intensified. The blocking pattern consists of the middle-latitude cyclonic system (to Sandy’s northeast) and anti-cyclonic system (to the north of the cyclonic system). In the next 24-36 hours, Sandy interacted with the intensifying upper-level trough, which moved eastward from 130 degrees west longitude on Oct. 23. Sandy then turned northwestward and made landfall in New Jersey. The corresponding animation is available as a Google document at http://goo.gl/hMkNd. Scientific significance: One of the major challenges in TC-genesis prediction is the accurate simulation of the complex interactions across a wide range of scales, from the large-scale environment (deterministic) to mesoscale flows down to convective-scale motions (stochastic). Therefore, the improvement in intensity prediction relies on the accurate representation of a TC’s structure and its interactions with both large-scale environmental processes and small scale moist processes (such as convection and surface fluxes exchanges). In this study, the role of multiscale processes associated with tropical waves in the predictability of hurricane Sandy (2012) is studied by the facilitation of the Coupled Advanced global Modeling and Visualization (CAMVis) systems that brings the multiscale interaction processes into vivid illustration. Relevance for Future Missions: This study addresses the support for the Earth Science missions described in the Decadal Survey (DS) report (National Research Council, NRC, 2007) and the successor Midterm Assessment Report (NRC, 2012), which include, but are not limited to, the following missions: the Global Precipitation Measurement (GPM),the Cyclone Global Navigation Satellite System (CYGNSS), the Soil Moisture Active-Passive(SMAP), the Aerosol-Cloud-Ecosystems (ACE), Precipitation and All-Weather Temperature and Humidity (PATH), and Three-dimensional Tropospheric winds from Space-based Lidar (3D-winds) missions. Among the scenarios of these DS Missions, “Extreme Event Warning” and “Climate Projections” have been identified as two of the top-priority challenges by the advanced data processing group at the ESTO AIST PI workshop (AIST, 2010). In the coming years, the CYGNSS and GPM will provide measured wind fields and precipitation fields for improving the understanding of physical processes for the genesis and intensification of hurricanes.These data will be used in our modeling and visualization studies. Earth Sciences Division - Atmospheres
Surface Albedo Changes from Wildfires in Northern Sub-Saharan Africa C.K. Gatebe (USRA/613), C. M. Ichoku (GSFC), R. Poudyal (SSAI/613), M. Román (GSFC/619), and E.M. Wilcox (DRI) The study derives new trajectories of post-fire albedo dynamics for sub-Saharan Africa from MODIS multi-year observational data (2003–11). Earth Sciences Division–Atmospheres
Name: Charles Gatebe, Universities Space Research Association (USRA) and NASA/GSFC, Code 613 E-mail: charles.k.gatebe@nasa.gov Phone: 301-614-6228 References: Gatebe, C. K., C. M. Ichoku, R. Poudyal, M. Román, and E. Wilcox (2014): Surface Albedo Darkening from Wildfires in Northern Sub-Saharan Africa, Environmental Research Letters., 9, doi:10.1088/1748-9326/9/6/065003. Data Sources: MODIS (Collection 5) albedo product, MCD43A3; MODIS Land Cover product (MCD12Q1); MODIS Level-3, 8-day daily active fire product (MOD14A2); CAR surface reflectance product from CLASIC (Cloud and Land Surface Interaction Campaign). Technical Description of Figures: Figure a) shows fires (red dots) detected over northern sub-Saharan Africa (NSSA) in 2011 by MODIS on Terra & Aqua satellites. Figure b) shows average decrease of albedo after fires. Figure c) shows Post-fire albedo recovery. Scientific significance: The study demonstrates simple methods for characterizing and deriving the trajectories of post-fire albedo dynamics from satellite data that is consistent and widely available. Results show that savannas accounted for >86% of the total MODIS fire count between 2003 and 2011 in Northern sub-Saharan Africa. That only a small fraction of the savanna pixels (⩽10%) burn in two successive years and about 47% had any fire recurrence in 9 years. The evergreen broadleaf shows a different pattern, where there is a peak between the third and fourth year, and a second peak after the eighth year. A total of 15% of the evergreen broad leaf pixels that burned in 2003 had burned again by 2011. Furthermore, we find that the persistence of surface albedo darkening in most land cover types in the NSSA region is limited to about 6–7 years, after which at least 99% of the burnt pixels recover to their pre-fire albedo. These results will provide critical information for deriving necessary input to various models used in determining the effects of albedo change due to wild fires in sub-Saharan Africa region. Scientific significance, societal relevance, and relationships to future missions: This study part of a NASA funded interdisciplinary effort (PI: C. Ichoku) to assess surface, atmospheric and water cycle processes in sub-Saharan Africa through remote sensing and modeling approaches that integrate research, systems engineering, and applications expertise to best make the connections between various identified processes and phenomena. Quantifying surface albedo variations due to fire disturbances on time scales of several months to several years using satellites records is a major goal for future NASA missions. Earth Sciences Division–Atmospheres
U.S. Air Quality Improvement NASA OMI NO2 Team (Code 614), Scientific Visualization Studio (Code 606.4), NASA/GSFC (a) 2011 (b) (c) Atlanta, GA Denver, CO Decrease in tropospheric NO2 columns from 2005 to 2011 in (a) the eastern U.S., (b) Atlanta, GA, and (c) Denver, CO due to technology improvements, including the implementation of emission control devices on power plants, in response to federal/state NOx emissions reduction programs. Earth Sciences Division - Atmospheres
Name: Point of Contact, NASA/GSFC, Code 614 E-mail: nickolay.a.krotkov@nasa.gov, lok.lamsal@nasa.gov Phone: 301-614-5553, 301-614-5160 References: NASA web highlight released June 26 2014: http://www.nasa.gov/content/goddard/new-nasa-images-highlight-us-air-quality-improvement/#.U6wymKUwRG4, Lamsal L. N. et al., Nitrogen oxides trend over the United States: The view from the ground, the view from space, manuscript in preparation. Data Sources: NASA standard OMI high resolution (<0.1ᵒ×1ᵒ) Level 3 tropospheric NO2 column products. http://disc.sci.gsfc.nasa.gov/Aura/data-holdings/OMI/omno2d_v003.shtml, http://avdc.gsfc.nasa.gov/pub/tmp/OMNO2_Nested/ Technical Description of Figures: Graphics: (a) Emissions of nitrogen oxides (NOx) is changing over the United States due to environmental regulations and technological change.We use observation of tropospheric NO2 from the Ozone Monitoring Instrument (OMI) onboard the AURA satellite to examine NOx emission reductions and their impact on US air quality. Nitrogen dioxide pollution, averaged yearly for 2005 and 2011 show a dramatic decrease across the country, more notably in the eastern US. Overall decrease in NO2 columns is about 40%. (b) OMI observations show that Atlanta, GA has seen a 42 percent decrease in nitrogen dioxide between the 2005-2007 (left) and 2009-2011 (right) periods. Technology improvements, such as the implementation of emission control devices on power plants, mean that residents here are now breathing cleaner air. (c) Denver has seen a 22 percent decrease in nitrogen dioxide between the 2005-2007 (left) and 2009-2011 (right) periods. NASA's Discover-AQ, a multi-year airborne mission, is flying this summer in Denver to learn more about the region's wide range of air pollutants. Scientific significance, societal relevance, and relationships to future missions: The impact of technology to reduce emissions of nitrogen dioxide and sulfur dioxide from coal-fired power plants is apparent in satellite imagery. NOx emissions are reducing and air quality is improving in the US. In addition to satellites, NASA’s DISCOVER-AQ missions over Baltimore-Washington, DC region in 2011, Houston, TX in 2013, San Joaquin Valley, CA in 2013 and Denver, CO in 2014 help better understand air quality. NASA’s Earth venture mission – Tropospheric Emissions: Monitoring of Pollution (TEMPO), will for the first time make observations of major air pollutants, including NO2, across the North American continent hourly during daytime providing unprecedented opportunity to improve our understanding of emissions and air quality. TEMPO, together with Korean Geostationary Environment Monitoring Spectrometer (GEMS) and ESA’s Sentinel-4/UVN instrument, will form a constellation of geostationary satellite missions offering hourly observations of major air pollutants across the globe. Earth Sciences Division - Atmospheres