Download

1 / 8
90 likes | 252 Views
Hurricane Sandy in Marinexplore.org. By Detelina Ivanova divanova09@gmail.com.

E N D
Hurricane Sandy in Marinexplore.org By Detelina Ivanova divanova09@gmail.com
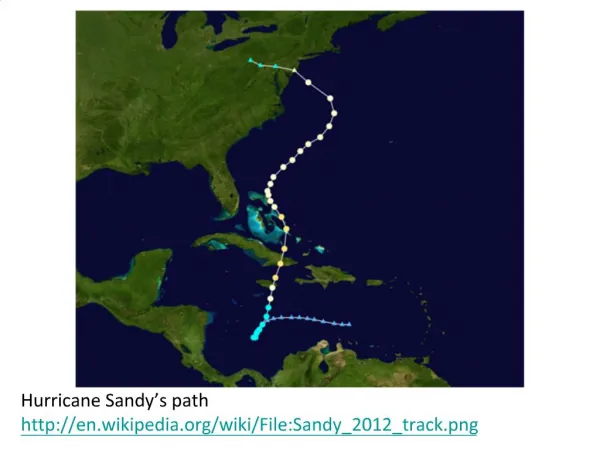
Hurricane Sandy caused about $50 billion damages and at least 285 fatalities setting up a record of one the most catastrophic hurricanes in the U.S history. The forecast failed to predict its extra-tropical landfall showing rather a path toward the open sea. Data collections such as Marinexplore.orgcan help to improve the model forecasts (by assimilating them in the forecasting model in real time) and to understand better the processes behind this hard to predict storm behavior and eventually improve the model physics.
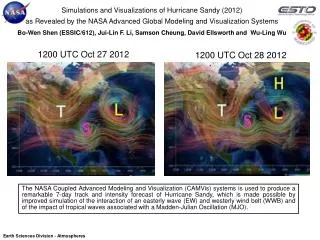
Sudden changes in the storm tracks can be triggered by changes in the underlying surface (ocean-land contrast, warm-cold ocean contrast). The goal of this project is by using the available data sets in Marinexplore.org to evaluate the ocean pre-conditioning and changes in response to the passage of Hurricane Sandy. Subsets of daily gridded data during the Sandy period- 10/24-10/29/2012 were extracted from the blended products NOAA/NCDC 0.25° sea surface winds and G1SST 1km sea surface temperature. Below are shown snapshots of sea surface winds vectors and speed (color field) and the spatial sea surface temperature anomaly. The black line represents the storm track of Hurricane Sandy from its genesis on 10/22/12 in the Caribbean Sea south of Jamaica, trough its stage of a major hurricane (category 3) when over eastern Cuba (10/25/12, pos.4) to its extra-tropical landfall near Brigantine, New Jersey on 10/29/12. The black sun-like symbol shows the current day storm position.
In-situ data from ships, buoys and floats available in the area during that period were extracted to provide insights into the changes in the upper ocean structure in response to the passing storm. Here are shown the vertical sections of the upper 200m temperature layer along the storm track in three of the storm period dates. On October 23 the storm is in the beginning of his trail (position 2) and the vertical temperature structure in the later locations is still in pre-storm conditions. The later is characterized by the convergence of warm upper layers of equatorial waters and cold deeper layers of extra-tropical waters. The second temperature section from October 27 demonstrates the ocean response to the passing storm revealing intense warming at all levels down to 200m. Just 2 days after (bottom panel) a strong cold waters upwelling occurs behind the storm center (which is at that time in position 8).
Similar conclusions can be reached by analyzing the vertical temperature profiles at particular locations at different dates. Further Analysis of the salinity, ocean currents, as well as, precipitation and air temperature will give us better understanding of the air-sea interaction processes affecting the storm evolution.