Download
1 / 12
190 likes | 610 Views
Global Burden of Disease. Analyzing and visualizing big data in Global Health. Washington, DC, September 6, 2013 Peter Speyer Director of Data Development speyer@uw.edu / @ peterspeyer. IHME. Institute for Health Metrics and Evaluation, University of Washington

E N D
Global Burden of Disease Analyzing and visualizing big data in Global Health Washington, DC, September 6, 2013 Peter Speyer Director of Data Development speyer@uw.edu / @peterspeyer
IHME • Institute for Health Metrics and Evaluation, University of Washington • Providing independent, rigorous, and scientificmeasurement and evaluations • “Our goal is to improve the health of the world’s populations by providing the best information on population health” • Core funding by the Bill & Melinda Gates Foundation and the State of Washington • Created in 2007 • 80 researchers, 60 staff
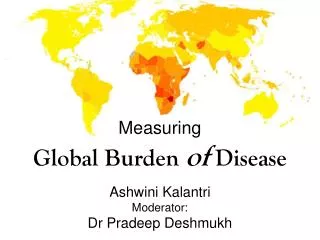
The Global Burden of Disease Study A systematicscientificeffort to quantify the comparative magnitude of health loss due to diseases, injuries and risk factors by age, sex, geographies for specific points in time. Collaboration with 488 individuals from 300 organizations in 50 countries Published in 2012 in the Lancet
Understanding burden Disability Weight YLLs YLDs YLDs Deaths YLLs (Years of Life Lost) YLDs (Years Lived with Disability) DALYs (Disability-Adjusted Life Years) Death Maximum life expectancy
GBD – it’s big data • 187 countries • 1990, 2005 and 2010 • 291 causes / 1160 specific outcomes • 66 risk factors • 20 age groups • Male/female/total • 5 key metrics: deaths, YLLs, prevalence, YLDs, DALYs • Surveys • Censuses • Vital registration • Disease registries • Hospital records • Surveillance systems • Mortuaries / burial sites • Police records • Literature reviews
Global Burden of Disease Analyzing and visualizing big data in Global Health Peter Speyer Director of Data Development speyer@uw.edu / @peterspeyer http://ihmeuw.org