Download

1 / 35
370 likes | 641 Views
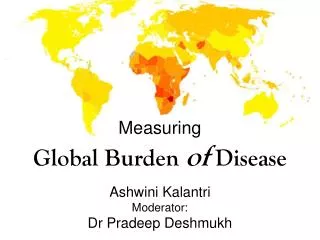
Measuring Burden of Disease. By Vikash Keshri Moderator: Prof. A. M. Mehendale. Presentation Outline. Historical aspects: Evolution of Summary Measure of Population health Introduction: Summary measure of Population health: Why Important Global burden of Disease study.

E N D
Measuring Burden of Disease By Vikash Keshri Moderator: Prof. A. M. Mehendale
Presentation Outline • Historical aspects: • Evolution of Summary Measure of Population health • Introduction: • Summary measure of Population health: • Why Important • Global burden of Disease study. • Disability Adjusted Life Years: DALYs. • Measure, Calculations, Social and Cultural, Sensitivity analysis. • Why important • Criticism of DALY • Healy • Conclusions:
Introduction: • Summary information of diseases and injuries, their incidences, their consequence, their causation and their trend is necessary for policy-making. • WHO’s Role: Summary Measure of Population Health. • WHO aims to measure both overall burden and the burdens imposed by individual diseases. • Summary measures of population health are measures that combine information on mortality and non-fatal health outcomes to represent the health of a particular population as a single number.
Historical Aspects: • 1940s: Dempsey's concept of using “Years of Life Lost”. • Various measures also introduced. All are examples of “mortality gaps”. • Sullivan Index Developed in 1971 emphasized on (a) the expectation of life free of disability and (b) the expectation of disability. • Wilkin and Adams (1983) published a paper on Health expectancy on Canada and proposed a new measure that is Quality Adjusted Life Expectancy (Q A L E). • 1988 , GBD study commenced. • 1993, World Development Report: Investing In Health used DALY for the First time. • 1998, Hyer A. A., Introduced HeaLY. • DALE, HALE, QALY, DFLE followed
Why Summary Measure of Population Health ? • Simplest method for population health statistics is to aggregate data and present proportion of the population. • Difficult if number of problems are monitored. • Or comparisons over time, across population groups, or before and after some health intervention required. • The potential applications of S M P Hare: • Comparison of health conditions or overall health status. • Quantification of health inequalities. • Inclusion of non-fatal health outcomes. • Measuring magnitude of different health problems using a common metrics. • Cost Effective Analysis of the benefits of health interventions. • Information in setting priorities for health planning, public health programs, research and development, and professional training.
Summary measures of population health: two types • Health expectancies: i.e. Disability free life expectancy, disability adjusted life expectancy. • Health gaps: i.e. Disability-adjusted life years, healthy life years.
The Survivor Curve Mortality Suboptimal Health Time lived in Optimal Health
Total Life Expectancy at Birth: L. E. = A+ B • Health expectancies : Population indicators that estimate the average time (in years) that a person could expect to live in a defined state of health. HE = A + f (B) • Where ‘f ’is some function that assigns weights to years lived in suboptimal health (optimal health has a weight of 1). • Health gaps: Measure the difference between actual population health and some specified norm or goal. • Health gap = C + g (B) • Where ‘g’ is some function that assigns weights to health states lived during time B, but where a weight of 1 equates to time lived in a health state equivalent to death. • Health gaps extend the notion of mortality gaps to include time lived in states of suboptimal health i.e. part of area B in Survival Curve.
Relating S M P H to Causes: • Two dominant traditions in widespread use for causal attribution: • Categorical attribution: • An event (death) attributed to single cause . • Such rules insensitive in dealing with multicausality and co-morbidity. • Health Gap • Counterfactual analysis: • The contribution of a disease, injury or risk factor is estimated by comparing the current and future levels. • For example, we could ask what the burden of disease would be if no one in population ever smoked. • Health Expectancy
Sullivan’s Index: • 1971 by Daniel F Sullivan. • The Sullivan index combines death rates with illness rates. • Expectation of Life Free of Disability = Life Expectancy – Duration of Disability & Inability to perform major activities. • The two related indices were also described based upon a life table model. (a) The expectation of life free of disability and (b) The expectation of disability.
Global Burden of Disease Study • The Global Burden of Disease and Injury (GBD), began in 1988. • World Bank, World Health Organization (WHO) and Harvard School of Public Health. • Major Objectives of G B D study: • To facilitate the inclusion of non-fatal health outcomes in the debate on international health policy which were all too often focused on mortality in children under 5 year of age. • To decouple epidemiological assessment from advocacy so that estimates of mortality and disability from a condition are developed as objectively as possible and, • To quantify the burden of disease using a measure that could also be used for cost-effectiveness analysis.
DALY: Disability Adjusted Life Years • Health gap measure, combines both times lost due to premature mortality and non-fatal conditions. • Using DALYs, the GBD was measured for 1990 and projections were developed to 2020 for the first time. • Extends the Concept of PYLL. • DALY = YLL + YLD. • YLL = Year of Life Lost due to Premature Death and • YLD = Year of Life Lived with Disability.
Social Values Incorporated in Calculating DALYs: • five key social preferences or values: • Duration of time lost due to a death at each age • Disability weights • Age-weights, • Time preference: • Health is simply added across individuals: • Duration of Life Lost: • Measure years of life lost due to premature mortality • Requires defining the potential limit of life • Standard years of life lost are used • Life expectancy at birth for females of 82.5 • Potential life expectancy at birth for males has been set at 80.1.
Disability weights • Degrees of incapacity or suffering associated with different non-fatal conditions. • Necessary to make comparisons across diseases. • Comparing time lived with a disability with time lost due to premature mortality. • Six disability classes defined. • Weight, ranging from 0 (perfect health) to 1 (death), for each of the six disability classes. • Age-weights: • Indicate the relative importance of healthy life at different ages. • Rise from birth until age 25 and decline slowly.
Figure 2: Value of a Year of Life Lived at Different Ages for Various Values of Beta
Time preference: • Value of health gains today compared to the future. • use the discount rate to discount benefits in the future • The discount rate used in the DALY formula is 3 percent • Health is simply added across individuals: • Two people each losing 10 years of disability-free life are treated as the same loss as one person losing 20 years.
Figure 3: Effect of Discounting in a Year of Life lost at various time in the future
Estimating Years Of Life Lost Due To Premature Mortality: (Y L L) • Standard Expected Years of Life Lost (SEYLL) method. • Advantages: • Deaths at all ages contribute to the calculation of the burden of disease; and • Deaths at the same age contribute equally to the burden of disease. Epidemiological estimates for diseases: (YLD) • Most Difficult Component. • Require in depth understanding of the epidemiology . • Data required: disability incidence, disability duration, age of onset, and distribution by severity class disaggregated by age and sex. • Further estimates of incidence, remission, case-fatality rates or relative risks by age and sex. • With zero discounting and uniform age weights, the basic formula for calculating YLD is • YLD = I x D W x L • I =incident cases , D W = disability weight (in the range 0-1) L = average duration of disability (measured in years).
Figure 4: The Value of Years of Life Lost Due to a Death at Varying Ages by Sex, with and without Discounting and Age Weighting.
Example: A female child who contracts poliomyelitis at age five. As a result she can die; she can live for a period of 5 years and then die; she can be permanently disabled; or she can recover after a period of disability. Assumption: • Life Horizon: 82.5 Years • Disability weight for this case: 0.5 Scenario 1: Baby dies at 5 years of age: Immediate death. DALY = 35.5
Scenario 2: DALYs Lost Due to Death Following Disability. DALY lost due to disability = 2.0 DALY Lost due to Premature death at 10 years = 36.85 Convert the 36.85 DALYs calculated at age 10 to their value at the age of onset of the disease, that is at age 5. DALY = 36.85 x 0.86 = 31.7 Total DALY = 31.7 + 2 = 33.7
Scenario 3: DALY lost due to permanent disability: DALYs =17.92. • Scenario 4: DALYs Lost Due to Disability Followed by Complete Recovery. DALYs = 2.0 years.
At Community or Population Level: • 20 cases of Poliomyelitis at age 5 years, 4 dies immediately, 4 dies at age 10 after 5 years of disability, 4 of them are permanently disabled, and 5 recovered. Total DALYs lost = 5 x (35.85) + 5 x (33.7) + 5 x17.92 + 5 x2 = 447.4
Data Needed to Estimate the Burden of Disease: • Age and Sex Specific causes of Death • To measure the time lived with a disability in a manner that can be meaningfully compared with the time lost due to premature mortality: • Age and gender specific information on the incidence of disease. • The proportion of disease incidence leading to a disabling outcome. • The average age of disability onset the duration of disability, and • The distribution of disability across the six classes of disability severity. • The scarce and unreliable data , Chances of error at two places: • Downward bias: Some disabilities might have been omitted. • Upwards Bias: Do not take into account co-morbidity (an individual experiencing multiple illnesses).
The problems of G B D methodology: • The need to expand and improve the list of diseases. • The need to improve the method to measure the time lived with disabilities of different severity. • The lack of methods to adjust for both dependent and independent co-morbidity. • The inability to quantify the contribution of risk factors in total burden of disease. • The lack of unit cost production functions to be used widely by researchers doing cost-effectiveness studies. • More accurate monitoring systems to be able to generate real estimates of mortality and disability by cause. • Projection methods that incorporate known levels and trends.
Criticisms • Requires a lot of data that is not readily available. • It is an expensive exercise. • Decisions are made by a group of experts with little involvement of health care providers, interest groups or beneficiaries. • The methodology is very complicated and does not add much information to what public health specialists already know. • It discriminates against the elderly. • The manner in which the information is manipulated is subjective. • It is difficult to create demand for services that are cost-effective. • The value choices that underlie the definition of the DALY are not universally accepted.
Leading cause of Burden of Disease (DALYs) in year 2004 according to Income of Countries.
DALY and QALY • Age = 50 • Utility of Deafness= 0.67 • Disability Weight = 1- 0.67 = 0.33 • Not taking Age weighting and discounting • QALY = 0.67 x 50 = 33.5 QALY • DALY = 0.33 X 50 +30 X 1= 46.5 Source: Arnesen T, Nord E. The value of DALY life: problems with ethics and validity of disability adjusted life years. BMJ. 1999 Nov 27;319(7222):1423-5.
References: 1. Sullivan DF. A single index of mortality and morbidity. HSMHA Health Rep. 1971 Apr;86(4):347-54. 2. World Bank: World Development Report; Investing in Health. New York1993. 3. R Bonita RB, T Kjelistrom., editor. Basic Epidemiology. second ed. Geneva: WHO; 2004. 4. R DetelJM, R Beaglehole, Tanaka Heizo, editor. Oxford Textbook of Public Health. Fourth ed. New York: Oxford University Pres; 2004. 5. Homedes N. Disability Adjsuted Life Years; Definition, Calculation and Potetial use. Human Capital Development; Working Papers: World Bank; 1996. p. 2 -12. 6. Lopez AD, Mathers CD, Ezzati M, Jamison DT, Murray CJL. Measuring the Global Burden of Disease and Risk Factors, 1990-2001. 2006. 7. Lopez AD, Murray CC. The global burden of disease, 1990-2020. Nat Med. 1998 Nov;4(11):1241-3. 8. Murray CJ. Quantifying the burden of disease: the technical basis for disability-adjusted life years. Bull World Health Organ. 1994;72(3):429-45. 9. Murray CJ, Lopez AD. Quantifying disability: data, methods and results. Bull World Health Organ. 1994;72(3):481-94.
References…. 10. Murray CJ, Lopez AD, Jamison DT. The global burden of disease in 1990: summary results, sensitivity analysis and future directions. Bull World Health Organ. 1994;72(3):495-509. 11. Anand S, Hanson K. Disability-adjusted life years: a critical review. J Health Econ. 1997 Dec;16(6):685-702. 12. WHO. NATIONAL BURDEN OF DISEASE STUDIES: A PRACTICAL GUIDE. Geneva2001. 13. Wilkins R, Adams OB. Health expectancy in Canada, late 1970s: demographic, regional, and social dimensions. Am J Public Health. 1983 Sep;73(9):1073-80. 14. Arnesen T, Nord E. The value of DALY life: problems with ethics and validity of disability adjusted life years. BMJ. 1999 Nov 27;319(7222):1423-5.