
Understanding the Empirical Rule: A Statistical Approach to Data Analysis
E N D
Presentation Transcript
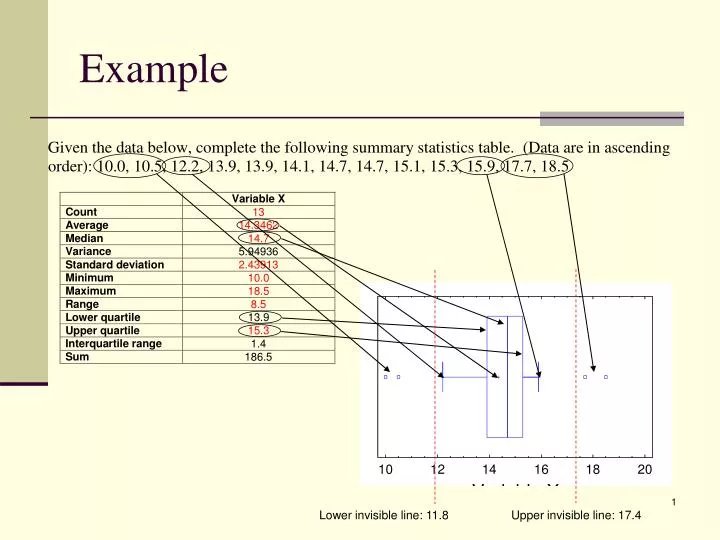
Example Lower invisible line: 11.8 Upper invisible line: 17.4
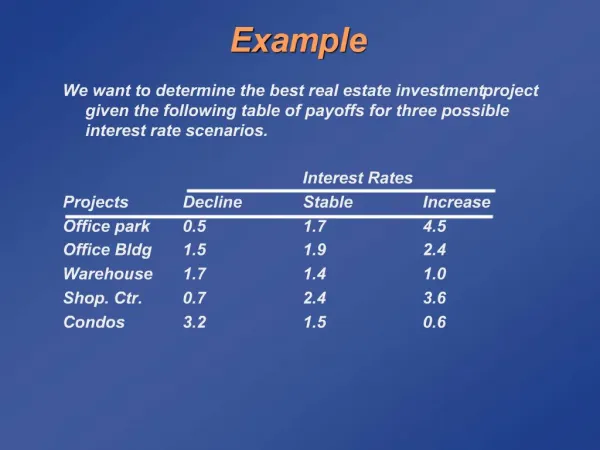
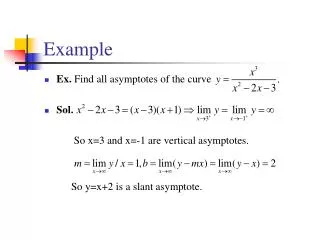
Example • A set of data whose histogram is bell shaped yields a sample mean and standard deviation of 50 and 4, respectively. Approximately what proportion of observations • Are between 46 and 54? • Are between 42 and 58? • Are between 38 and 62? • Are less than 46? • Are less than 58?
Example: The Empirical Rule A manufacturer of automobile batteries claims that the average length of life for its grade A battery is 60 months with a standard deviation of 10 months. 3 cars in your family used this brand of batteries and none of them lasted for more than 30 months. What do you think about the manufacturer’s claim?
What statistical lesson can we learn? “Should we scare the opposition by announcing our mean height or lull them by announcing our median height?”
Answer: Example • A set of data whose histogram is bell shaped yields a sample mean and standard deviation of 50 and 4, respectively. Approximately what proportion of observations • Are between 46 and 54? => 68% • Are between 42 and 58? => 95% • Are between 38 and 62? => 99.7% • Are less than 46? => 16% • Are less than 58? => 84%
Example: The Empirical Rule A manufacturer of automobile batteries claims that the average length of life for its grade A battery is 60 months with a standard deviation of 10 months. 3 cars in your family used this brand of batteries and none of them lasted for more than 30 months. What do you think about the manufacturer’s claim? => Assuming the claim was true, the chance of having 3 bad batteries is (0.15%) x (0.15%) x (0.15%), i.e., very small. This will certainly cause you to suspect the claim.