Download
1 / 69
690 likes | 704 Views
This research aims to optimize the Power Up concept by identifying the most successful combinations of benefits, flavors, and RTBs in the market. It also provides the ability to simulate consumer preference and prioritize flavor combinations.

E N D
Power Up Optimizer Research Prepared for PepsiCo GNG By Strategy Analytics July 2016
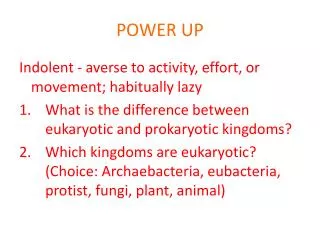
Research Background & Objectives Background Previous research indicates that the Power Up concept has solid purchase interest but there is risk to its overall success in the market based on other metrics To minimize risk, the team is looking to optimize the concept in order for it to deliver its strongest potential Research Objectives Identify the combinations of benefits, flavors, and rtb’s that have the highest chance of success in the market Provide the ability to simulate consumer preference for different combinations of concept elements Prioritize flavor combinations to understand potential expansion opportunities Gain reaction to 2 different positionings of SoluOats
Sampling and Survey Instrument • Methodology • Key Areas Explored • Target Audience • Sample • Planned: n=1200 in China • Cities • Beijing, • Shanghai • Guangzhou • Chongqing • Sample achieved: n=1221 20 minute online survey with qualified respondents, using Strategy Analytics Fieldwork was conducted in July 2016 A Discrete Choice Exercise was conducted for understanding product preferences A MaxDiff choice exercise was included to prioritize flavors • Reaction to different elements of a new smoothie concept • Prioritization of flavors • Product diagnostics, including brand, consumption, purchase expectations and Solu Oat expression • Associations with flavored milk and ambient yogurt categories • Attitudes • Demographics • Ages 18-54 in China • Mix of gender – 50/50 • Past 3 month consumers of Ambient Yogurt or Ambient Flavored Milk • No dietary restriction for milk or oats
Product Description Used as Stimuli Smoothie, a new milk with sunshine oats, New Zealand imported milk, and carefully selected fruit juice. Smoothie is thicker than normal dairy drinks, with a tasty, silky smooth mouthfeel. It is found on the grain milk shelf (non-refrigerated). “丝幕吸”, 一款新推出的乳品:结合了阳光燕麦,新西兰进口奶源和精心挑选的果汁。它比一般乳品拥有更醇厚的质地,口感顺滑。在谷物牛奶货架上有售(无需冷藏)。
Flavors Assessed • Strawberry & Blueberry • Strawberry & Cranberry • Orange & Mandarin 1 6 11 • Papaya & Banana • Red date & Longan • Pineapple & Banana 2 7 12 • Red apple & Pear • Mango & Pineapple • Peach &Apricot 3 8 13 • Oat & Honey • Coconut & Mango • Kiwi & Passionfruit 4 9 14 • Cherry & Red Dragon Fruit • Honeydew & Cantaloupe • Plum &Grape 5 10 15
Summary: Diagnostics • This new Smoothie product is well-liked by consumers • They expect to consume the product often, with 9 in 10 expecting to drink it at least weekly or more often • Smoothie would likely replace some of their current consumption of other dairy, oat and juice products • Most consumers see this new product as a breakfast product, or for in-between meals • Although this product is expected to mainly be consumed at home, there is opportunity to extend into other situations, especially in Shanghai • Although most consumers expect to buy this product at hyper or super markets, there are some differences by city, especially for convenience stores and club / membership stores • Some brands are clearly more aligned with this new product than others, led by Yili and Mengniu products, with some differences by city -- Quaker stronger in Shanghai and weaker in Beijing Interest is high - ensure the product does not cannibalize existing products by extending consumption context to other dayparts and locations Consider targeting distribution and communications differently for different markets
Summary: Impact on Choice Flavor, sweetness, and sugar content have highest impact on choice of the options shown Attribute Importance Product attributes that impact how the product would taste (flavor and sweetness) have high importance – ensure these are highlighted in communications and launch activities
Summary: Flavor The flavor of the product has more impact on preference than any other attribute Of the 3 flavors considered for launch… BERRY BLISS (Strawberry + Blueberry) is most preferred, and also is the top flavor choice when comparing to all 15 potential flavor options • The combination of 3 flavors with the highest consumer reach are: • Strawberry + Banana (BERRY BLISS) • Strawberry + Cranberry • Oat + Honey VITALITY SMOOTH (Papaya + Banana) has below average appeal, but is slightly higher in Beijing than Shanghai COLOR PLUS (Red Apple + Pear) is relatively weak compared to the other flavors, but has slightly stronger appeal in Chongqing than the other cities Launch Berry Bliss, but re-consider the other 2 launch flavors – if these are replaced, reach can increase significantly
Summary: Product Options –Clear Preferences The top 3 attributes impacting choice (flavor, sweetness and sugar content), all have clear preferences for specific options; additionally, the options where the product either has the option or does not, clearly impact choice Percentages represent the level of importance from the Discrete Choice Model When possible, select the options for the product that have the highest preference in order to maximize appeal and optimize the product at launch
Summary: Product Options – “Rich in…” It does not impact choice to say that the product is “rich in” an ingredient versus simply containing the ingredient – either way is equally appealing to consumers for these 3 options Percentages represent the level of importance from the Discrete Choice Model Use the terminology that is best aligned with legal recommendations and with business strategy
Summary: Product Options – Positioning While these attributes have impact on choice overall, the specific wording of the different options has little impact on choice Percentages represent the level of importance from the Discrete Choice Model Choose the attribute level that best aligns with business and market positioning strategy for these options
Summary: The Optimal Smoothie Product will be… Berry Bliss (Strawberry & Blueberry) Moderately sweet Low in sugar containing… Whole grains Probiotics Special oat processing supporting… digestive health, making you nutritious and smooth Note: Attributes with only minor differences between levels, or that could be implied based on ingredients, did not have as much impact With somewhat less impact from… Vitamins Type of oats Dietary Fiber Protein Brand expert / experience Calcium
A Discrete Choice Modeling (DCM) methodology was used to measure the relative importance of attributes andoptimize the product configuration What is DCM? Benefits • Measure preference for products based on various attributes and levels • Discrete Choice modeling is an Econometric technique used in marketing research to guide product optimization, pricing, product concept testing, and many other areas of strategic and tactical interest. • Discrete Choice analysis yields a measure of the relative importance of each attribute, and a measure of the strength of influence of each level of each attribute. • The key parameters on which choice decision depends will be traded-off by the respondent across multiple screens with randomized levels of the finalized attribute list Understand how the changes to attributes/levels impact demand for products And estimate the likely acceptance of a new product, relative to others Thinking about: Smoothie, a new milk with sunshine oats, New Zealand imported milk, and carefully selected fruit juice. Smoothie is thicker than normal dairy drinks, with a tasty, silky smooth mouthfeel. It is found on the grain milk shelf (non-refrigerated). If these were your options, which would you choose? Please choose by clicking one of the buttons below.
Flavor has a strong impact on preference for this Smoothie product, followed by sweetness level and sugar content; preference is similar regardless of target consumer group Attribute Importance * 80:20 represents the sample when 80% is female and 20% is male • Base: Total Sample; Overall=1221, Beijing=337, Chongqing=247, Guangzhou=249, Shanghai=388, Male= 613, Female= 608, 80:20=759 • DCE- Thinking about -PRODUCT DESCRIPTION- If these were your options, which would you choose?
Clear differences in preference for specific flavors, sweetness levels, and containing low sugar, whole grains, or probiotics; most other levels have less impact on preference Attribute/ Level Importance • Base: Total Sample=1221 • DCE- Thinking about -PRODUCT DESCRIPTION- If these were your options, which would you choose?
A Max Diff methodology was used to identify the relative preference of different flavor combinations Each flavor was considered and the MOST and LEAST preferred was selected using a choice exercise BENEFITS THE OUTPUT • Strong discrimination power • It is a simple task for the respondent • Allows testing a large number of items • Eliminates scaling bias • Allows for diversity of sample • Provides ratio data and a measure of magnitude • The standard output of MaxDiff analysis is a ranking of the items tested based on rescaled utilities. • In this project the output is referred to as CPS, Consumer Priority Score which gives an indication of its importance relative to other health and wellness benefits. • The CPS is based on rescaled utilities, which can also be used to conduct further multivariate analysis such as correlation analysis, multiple regression, TURF analysis, cluster analysis, latent class segmentation, etc Least Prefer Most Prefer Strawberry & Blueberry When thinking about a new product like this, which of the following flavors would you MOST prefer and which would you LEAST prefer? Papaya & Banana Red Apple & Pear Oat & Honey
Three flavors are clearly preferred, with most “middle of the pack”; two fall to bottom Prioritization of Flavors: Consumer Priority Scores Berry Bliss Vitality Smooth Color Plus • Base: Total Sample=1221 • B1.When thinking about a new product like this, which of the following flavors would you MOST prefer and which would you LEAST prefer?
While top and bottom flavors are consistent across all markets, there is some difference in priority, with Color Plus (Red Apple + Pear) slightly more appealing in Chongqing (although still fairly low) Prioritization of Flavors- Ranking by City Berry Bliss= Strawberry & Blueberry Vitality Smooth=Papaya & Banana Color Plus=Red Apple & Pear 3/-3 Ranking change from overall • Base: Total Sample; Overall=1221, Beijing=337, Chongqing=247, Guangzhou=249, Shanghai=388 B1. When thinking about a new product like this, which of the following flavors would you MOST prefer and which would you LEAST prefer?
The flavor combination that will reach the largest number of consumers is Strawberry + Blueberry (Berry Bliss), Strawberry + Cranberry, and Oat + Honey TOP 10 (3-flavor combinations) Berry Bliss Vitality Smooth Color Plus Base: Total Sample=1221; BASED ON TURF ANALYSIS OF FLAVOR MAXDIFF PROBABILITIES OF CHOICE B1. When thinking about a new product like this, which of the following flavors would you MOST prefer and which would you LEAST prefer?
Milling “technology” slightly outpaces “process”, especially in Beijing and Chongqing Milling Technology 1 out of 3 find both statements appealing Difference is more than 5%/-5% from Overall Base: Total Sample; Overall=1221, Beijing=337, Chongqing=247, Guangzhou=249, Shanghai=388 P10 - Thinking about this new Smoothie product, which of the following statements is more appealing to you?
Some brands are clearly more aligned with this new product than others, led by Yili and Mengniu products; Quaker has strong potential, particularly among grain brands Brand Diagnostics Quaker Inner Smile is among the top 10 brands considered and has the second highest “most likely to buy” • Base: Consideration (Overall sample)= 1221 , Most Likely (Brand Considerers)= 1195 • P1. From which of the following brands would you consider buying a product like this? • P2. From which of these brands would you be most likely to buy a product like this?
There are some differences in brand alignment by city, with Quaker stronger in Shanghai and weaker in Beijing Brand Consideration Difference is more than 5%/-5% from Overall • Base: Total Sample; Overall=1221, Beijing=337, Chongqing=247, Guangzhou=249, Shanghai=388 • P1. From which of the following brands would you consider buying a product like this?
Most consumers think they would drink this new product frequently, with 9 in 10 saying at least once a week, and a third expecting to consume it at least once a day Frequency of Consumption Difference is more than 5%/-5% from Overall • Base: Total Sample; Overall=1221, Beijing=337, Chongqing=247, Guangzhou=249, Shanghai=388 • P3.If you were to buy this product, how often do you think you would consume this product?
Most consumers see this new product as a breakfast product, or for in-between meals Consumption Occasions – City level Difference is more than 5%/-5% from Overall • Base: Total Sample; Overall=1221, Beijing=337, Chongqing=247, Guangzhou=249, Shanghai=388 • P4. If you were to buy this product, at what time(s) during the day do you think you would consume this product?
Although this product is expected to mainly be consumed at home (followed by work/school), there is opportunity to extend into other situations, especially in Shanghai where socializing, relaxing, or dining out are higher Consumption Situations Difference is more than 5%/-5% from Overall • Base: Total Sample; Overall=1221, Beijing=337, Chongqing=247, Guangzhou=249, Shanghai=388 • P5. If you were to buy this product, in which situations do you think you would consume this product?
Although most consumers expect to buy this product at hyper or super markets, there are some differences by city, especially for convenience stores, and Chongqing is more likely to buy at a club / membership store Purchase locations Difference is more than 5%/-5% from Overall • Base: Total Sample; Overall=1221, Beijing=337, Chongqing=247, Guangzhou=249, Shanghai=388 • P6. If you were to buy this product, at which of the following places do you think you would buy it? (Please select all that apply)
About half of consumers say it would replace some of their current consumption of dairy, oat and juice products Impact On Consumption- Across Categories Dairy Consumption Oat Consumption Juice Consumption • Base: Total Sample=1221 • P7/P8/P9. If you were to buy this product, how do you think your consumption of other DAIRY/OAT / JUICE products would change?
Looking specifically at dairy products, Beijing consumers are more likely to say they would consume Smoothie in addition to their current dairy products, while Shanghai consumers say it would replace some of their dairy Impact On Consumption- Dairy Products Difference is more than 5%/-5% from Overall • Base: Total Sample; Overall=1221, Beijing=337, Chongqing=247, Guangzhou=249, Shanghai=388 • P7. If you were to buy this product, how do you think your consumption of other DAIRY products would change?
Smoothie is likely to replace some current oat consumption for most consumers Impact On Consumption- Oats Products Difference is more than 5%/-5% from Overall • Base: Total Sample; Overall=1221, Beijing=337, Chongqing=247, Guangzhou=249, Shanghai=388 • P8. If you were to buy this product, how do you think your consumption of other OATS products would change?
Similar to dairy consumption, juice consumption expectations vary by city, especially Beijing and Shanghai Impact On Consumption- Juice Products Difference is more than 5%/-5% from Overall • Base: Total Sample; Overall=1221, Beijing=337, Chongqing=247, Guangzhou=249, Shanghai=388 • P9. If you were to buy this product, how do you think your consumption of other JUICE products would change?
Most of these products are purchased at high levels, with a third of consumers having purchased fruit smoothies in the last 3 months Product Purchased DAIRY PRODUCTS GRAINS PRODUCT FRUIT PRODUCT PROTEIN PRODUCT Base: Total Sample=1221 S05. Which of the following products have you purchased in the last three months?
Plain milk and yogurt are consumed most frequently among the dairy products Product Frequency of Consumption Daily Consumption DAIRY PRODUCTS Base: Ambient white dairy milk=799, Ambient yogurt=840 , Chilled yogurt=740, Ambient flavored milk beverages / milks =420, Probiotic drink=704, Ambient fruit flavored milk=581, Ambient grains flavored milk beverages=548, Chilled white dairy milk=560, Ambient grains flavored milk=560, Chilled flavored milk=493, Ambient fruit flavored milk beverages=575, Powdered milk=368 C4.You mentioned earlier that you have consumed the following products in the past 3 months. How often do you consume each of these products?
Of the other product categories, fruit and hot cereal are consumed most often Product Frequency of Consumption Daily Consumption GRAINS PRODUCT FRUIT PRODUCT PROTEIN PRODUCT Base: Hot cereal=476, Cold (ready-to-eat) cereal=398, Instant grain congee=404, Sweet biscuits / cookies=684, Savory biscuits/ crackers=612, Snack bars=378, Fruit=795 , Fruit snacks=482, Fruit juice=711, Fruit smoothies=429, Soy Drink=397, Grain Drink=524, Nut Drink=426 C4.You mentioned earlier that you have consumed the following products in the past 3 months. How often do you consume each of these products?
Consideration outpaces current consumption for most brands; about ¼ of consumers have purchased Quaker in the last 3 months, and about 1 in 5 have purchased Tropicana Brand – Current Purchased Vs Future Consideration • Base: Total Sample=1221 • C2: Which of the following brands have you purchased in the last three months? • C3: Which of the following brands would you consider purchasing in the future?
Quaker Inner Smile is set for growth across cities, except Guangzhou where consideration matches current purchase levels Brand – Current Purchased Vs Future Consideration • Base: Total Sample; Overall=1221, Beijing=337, Chongqing=247, Guangzhou=249, Shanghai=388 • C2: Which of the following brands have you purchased in the last three months? • C3: Which of the following brands would you consider purchasing in the future? Significantly higher from current Vs future
Top associations differ for flavored milk (good taste, many varieties/flavors) and ambient yogurt (nutritious, easy to digest) Product Associations Flavored Milk Ambient Yogurt • Base: Total Sample=1221 • C5.Thinking specifically about flavored milk and ambient yogurt, which of the following do you associate with each of these products?
Lowest associations seem dairy-related, with low alignment of lactose free, no negative effect from animal based products, and non allergenic Product Associations Flavored Milk Ambient Yogurt • Base: Total Sample=1221 • C5.Thinking specifically about flavored milk and ambient yogurt, which of the following do you associate with each of these products?
Consumers in China slightly prefer flavored milk beverages with texture with small bits in it (more prevalent in Shanghai), or to have the option of small bits or smooth texture Texture Preference Difference is more than 5%/-5% from Overall • Base: Total Sample; Overall=1221, Beijing=337, Chongqing=247, Guangzhou=249, Shanghai=388 • C6. Still thinking about FLAVORED MILK BEVERAGES, would you prefer flavored milk beverages that have a smooth texture or that have small bits of grain, nut, or seed included in them?
Agreement is equally high for seeking out products that support digestive health and those that support intestinal health Attitudes Agree completely/ somewhat • Base: Total Sample=1221 • C7. Please indicate how much you agree or disagree with each of the following statements.
For those consumers who were not included in this research because they do not consume ambient yogurt or flavored milk, no dominant reason stands out for not consuming these Reasons for not consuming- Ambient Yogurt and Flavored Milk Non consumers of Ambient Yogurt and Flavored Milk • Base: Total contacts= 1762; Eligible=1221, Terminates=541 • S06.You mentioned that you did not consume ambient yogurt or flavored milk/drinks, which of the following are reasons that you did not consume these products?