Download
1 / 12
120 likes | 141 Views
Explore the spatial dimensions of phenomena, map symbolization techniques, and visual variables for effective thematic cartography and geovisualization.

E N D
Principles of symbolization Mrs Diana Makarenko-Piirsalu MSc in Landscape Ecology and Environmental Protection Geolytics OÜ Mere tee 15, Saviranna, Jõelähtmevald, Harjumaa, ESTONIA diana.makarenko-piirsalu@geolytics.ee Mob. +372 556 19 636 ESTP Course: Use of GIS in NSIs – Representing statistics on thematic maps, Kongsvinger,Norway, 5th to 7th of March, 2013 Attribution (by) Licensees may copy, distribute, display and perform the work and make derivative works based on it only if they give the author or licensor the credits in the manner specified by these. http://creativecommons.org/licenses/by/3.0/
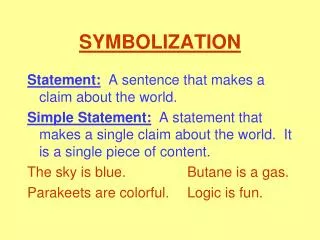
Spatial dimension of phenomena • Point phenomena • Linear phenomena • Areal phenomena • 3D phenomena • Continuous vs discrete phenomena • Smooth vs abrupt phenomena The choice of map symbols depends on the map scale and the data level of the phenomena to be displayed.
Continuos- discrete – abrupt – smooth phenomena • Considering the distribution of geographic phenomena is important in selecting proper spatial analyses or appropriate method of symbolisation in visualising data in thematic mapping Source: Thematic cartography and geovisualization, T A. Solcum et al, 2009
Visual variables Source : M. Carpendale, "Considering visual variables as a basis for information visualisation“, Dept. of Computer Science, University of Calgary, Canada, Tech. Rep. 2001-693-16, 2003,
Visual variables for different type of data • Quantitative data: • ordinal, interval, ratio Lightness (value), size, saturation, texture, spacing • Qualitative data: - nominal Color (hue), shape, position, orientation
Size • Typical person can easily distinguish maximum 5 different sizes • Size differences must be sufficiently large for map users to identify high and low values. • Works for all quantitative attributes. The size of the displayed object reflects the unit value of the phenomena. Source: http://cartography.uni-muenster.de/en/symbols
Texture • The number of patterns to fill an area is almost unlimited • use maximum 7-10 variations of brightness for one pattern Source: http://cartography.uni-muenster.de/en/symbols
Colour • Three attributes of colour; hue, value and saturation, can be used as graphic variables. • Hue is synonymous with colour for most people. It is the measure of wavelengths that a surface reflects resulting in perceived differences in red, blue, yellow etc. • Value is the lightness or darkness of a colour from pure black to pure white. • Saturation shows how pure the colour is compared to a grey tone of the same value. Source of pictures :http://en.wikipedia.org
Examples of color schems by C. Brewer - http://colorbrewer2.org/ • Sequential colour schemes: • are suited to ordered data that progress from low to high. • Lightness steps dominate the look of these schemes, with light colours for low data values to dark colours for high data values • Transitions between hues may be used in a sequential scheme, but the light-to-dark progression should dominate the scheme. Source : http://colorbrewer2.org/
Examples of color schems by C. Brewer - http://colorbrewer2.org/ • Diverging schemes: • put equal emphasis on mid-range critical values and extremes at both ends of the data range. • are most effective when the class break in the middle of the sequence, or the lightest middle colour, is meaningfully related to the mapped data. • Use the break or class emphasized by a hue and lightness change to represent a critical value in the data such as the mean, median, or zero. • Colours increase in darkness to represent differences in both directions from this meaningful mid-range value in the data. • A typical diverging scheme pairs sequential schemes based on two different hues Source : http://colorbrewer2.org/
Examples of color schems by C. Brewer - http://colorbrewer2.org/ • Qualitative schemes: • are best suited to representing nominal or categorical data. • do not imply magnitude differences between legend classes, and hues are used to create the primary visual differences between classes. • The lightness of the hues used for qualitative categories should be similar but not equal Source : http://colorbrewer2.org/
THANK YOU! Mrs Diana Makarenko-Piirsalu MSc in Landscape Ecology and Environmental Protection Geolytics OÜ Mere tee 15, Saviranna, Jõelähtmevald, Harjumaa, ESTONIA diana.makarenko-piirsalu@geolytics.ee Mob. +372 556 19 636 ESTP Course: Use of GIS in NSIs – Representing statistics on thematic maps, Kongsvinger,Norway, 5th to 7th of March, 2013