Download
1 / 14
160 likes | 315 Views
Learn how to model data with quadratic functions, graph parabolas, identify vertices & symmetry, and analyze wave speeds. Practice solving quadratic equations and interpreting graphs. Includes real-world examples and exercises for comprehensive learning.

E N D
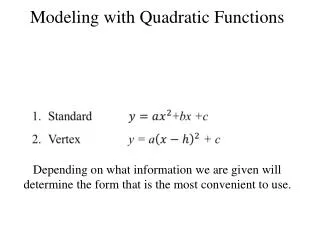
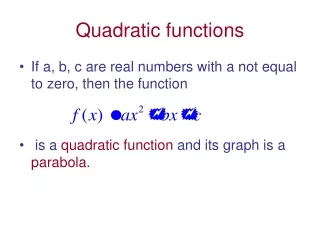
Quadratic Function • A function that can be written in the standard form: Where a ≠ 0
Determine whether each function is linear or quadratic. Identify the quadratic, linear and constant terms Ex. 1A: = (2x – 1)(2x – 1 ) Multiply Quadratic term = Linear term = -4x Constant term = 1
Ex. 1B = 1 none Quadratic term = 0x or 0 Linear term = Constant term = 1
Check Understanding • #1 A – C p. 235
Graph of Quadratic Function • The graph of a quadratic function is a parabola. • The axis of symmetry is the line that divides a parabola into two equal parts that are mirror images. • The vertex of a parabola is the point at which the parabola intersects the axis of symmetry.
Below is the graph of y = x2 – 6x + 11. Identify the vertex and the axis of symmetry. Identify points corresponding to P and Q. The vertex is (3, 2). The axis of symmetry is x = 3. P(1, 6) is two units to the left of the axis of symmetry. Corresponding point P (5, 6) is two units to the right of the axis of symmetry. Q(4, 3) is one unit to the right of the axis of symmetry. Corresponding point Q (2, 3) is one unit to the left of the axis of symmetry.
Check understanding • P. 235 # 2 A and B
x y –2 –17 1 10 5 –10 Ex. 3: Find a quadratic function to model the values in the table. Substitute the values of x and y into Solve the system for a, b and c.
Ex. 3 continued Use augmented matrices and the rref function to solve. A= -2, b = 7, c = 5
Check Understanding • #3
The table shows data about the wavelength x (in meters) and the wave speed y (in meters per second) of deep water ocean waves. Use the graphing calculator to model the data with a quadratic function. Graph the data and the function. Use the model to estimate the wave speed of a deep water wave that has a wavelength of 6 meters. Wavelength (m) 3 5 7 8 Wave Speed (m/s) 6 16 31 40
(continued) Wavelength (m) 3 5 7 8 Wave Speed (m/s) 6 16 31 40 Step 1: Enter the data. Use QuadReg. Step 2: Graph the data and the function. Step 3: Use the table feature to find ƒ(6). An approximate model of the quadratic function is y = 0.59x2 + 0.34x – 0.33. At a wavelength of 6 meters the wave speed is approximately 23m/s.
Homework • P. 237. # 1 – 37 EOO