Modeling Data with Quadratic Functions
110 likes | 150 Views
Learn to identify quadratic functions, graph their plots, and model data using quadratic functions. Dive into critical thinking exercises to understand the relation between side lengths of squares, explore general rules for perimeter and area, and graph results. Practice finding vertex, axis of symmetry, and quadratic models through hands-on and calculator-based methods. Sharpen your skills through homework problem-solving.

Modeling Data with Quadratic Functions
E N D
Presentation Transcript
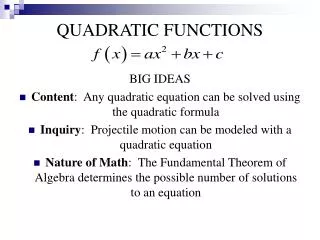
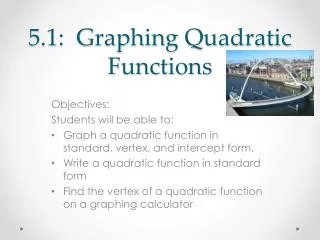
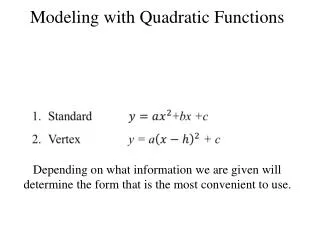
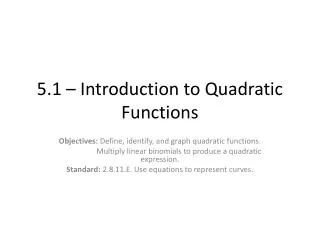
5.1 Modeling Data with Quadratic Functions Objectives: To identify quadratic functions and graphs and to model data with quadratic functions
Critical Thinking: • Investigate: • As the side lengths of a square increase by 1, what happens to its perimeter and its area? • Find a general rule to represent the relationship between any side length and its perimeter and area.
Quadratic Functions f(x) = 3x2 - 7 y = 2x2 + 3x + 4 f(x) = -10x2 – 3x y = (x + 2)(x + 3)
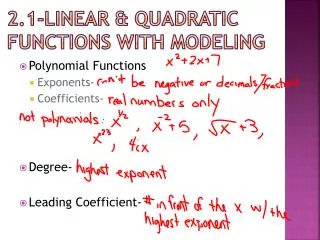
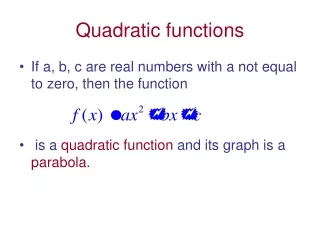
Quadratic Function A function of degree two; the largest exponent in the function is two Standard Form f(x) = ax2 + bx + c; Quadratic term Linear term Constant term a ≠ 0
Determine if the following is linear or quadratic. Identify the quadratic, linear, and constant terms. f(x) = (x + 2)(x – 7) f(x) = (x2 + 5x) – x2
Graphs of a Quadratic Function Parabolas Vertex(max/min) (2, 0)
Identify the vertex and the axis of symmetry of each parabola. Identify points corresponding to P and Q.
Finding a Quadratic Model Find a quadratic function that goes through (1, 0), (2, -3), and (3, 10) By hand… Substitute the values of x and y into y = ax2 + bx + c and solve the system of equations with three variables
Finding a Quadratic Model Using a graphing calculator… Enter the data into calc STAT, Edit Find equation STAT, CALC, QuadReg, Enter The table at the below shows the height of a column of water as it drains from its container. Model the data with a quadratic function. Use the model to estimate the water level at 35 seconds.
Homework Pg 237 #1-16, 20-22, 32-36 even