Download
1 / 28
280 likes | 308 Views
Dive into the evolutionary history of species from Pangaea to the Geologic Time Scale. Explore the richness of fossils, radiometric dating, and major mass extinctions. Understand taxonomy, cladograms, and homology in constructing the tree of life. Uncover the mysteries of convergent evolution and analogical adaptation. Take a captivating journey through the depths of biological diversity.

E N D
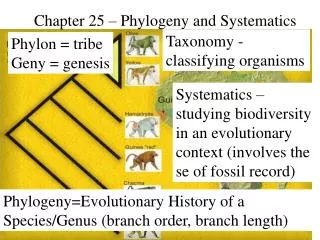
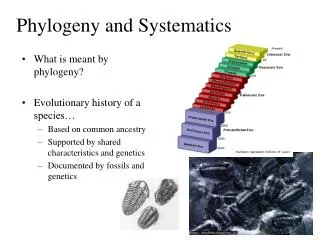
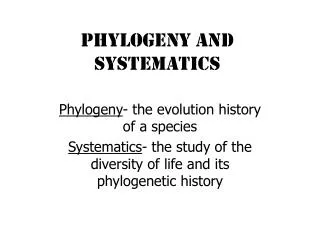
Phylogeny and Systematics • Phylogeny – evolutionary history of a species or group of related species • Systematics – study of biological diversity in an environmental context (tracing phylogeny) • Taxonomy - science of naming, identifying, and describing diverse forms of life • Pangaea – supercontinent of land masses (present 250 mya)
Sedimentary Rock Are The Richest Source of Fossils Dinosaur Bones Skull Petrified Trees Scorpion in Amber Leaf Fossilized Seashell
Geologic Time Scale • Major Events in Evolution • 4.6 bya – formation of the Earth (Precambrian) • 3.5 bya – prokaryotic cells • 2.2 bya – eukaryotic cells • 600 mya – soft-bodied invertebrates • 500 mya – colonization of land plants (Paleozoic) • 420 mya – jawless fish • 375 mya – bony fish, amphibians, insects • 325 mya – first seed plants, reptiles • 220 mya – cone-bearing plants (Mesozoic) • 175 mya – dinosaurs abundant • 80 mya – angiosperms • 60 mya – mammals, birds, pollinating insects (Cenozoic) • 30 mya – primate groups • 2.5 mya – apelike ancestors • 0.5 mya – humans appear
Radiometric Dating • The measurement of certain radioactive isotopes in fossils or rocks. • Half-life – the number of years it takes for 50% of the original sample to decay; it is unaffected by temperature, pressure, and other environmental variables • Carbon-14 to Nitrogen-14 → 5,730 years • Potassium-40 to Argon-40 → 1.3 billion years • Uranium-238 to Lead-206 → 4.5 billion years • Found in Volcanic Rock
The Fossil Record • The fossil record is far from being complete, it is slanted in favor of species that existed for a long time, were abundant and widespread, and had shells or hard skeletons. • A substantial fraction of species that have lived probably left no fossils, most fossils that formed have been destroyed, and only a fraction of the existing fossils have been discovered.
Major Mass Extinctions • Permian Period – 250 mya • 90% of marine animal went extinct • 8 out of 27 orders of Permian insects did not survive • The extinction occurred in less than 5 million years • Reasons • Occurred about the same time the continents merged to form Pangaea – Marine and terrestrial habitats disturbed • Massive volcanic eruptions in what is now Siberia – increase in atmospheric carbon dioxide = global warming • Global warming = reduced temp. differences between the poles and equator. Could lead to uneven mixing of the oceans which decrease amount of dissolved oxygen
Major Mass Extinctions • Cretaceous Period – 65 mya • Extinction of dinosaurs • Killed more than half of the marine species • Exterminated many families of terrestrial plants and animals • Reasons • The climate became cooler, and shallow seas receded from continental lowlands • Large volcanic eruption in what is now India • “Impact Hypothesis” – a large comet (dirt and ice) or small asteroid (rock and metal) collided with Earth
Taxonomy • Taxonomy – Binomial; based on a 2-part Latin name; genus and species. • Ex. Pseudacris nigrita, Homo sapiens • Hierarchical Classification – way for us to structure and view of our world
Coral snake Abert squirrel Sea star Grizzly bear Black bear Giant panda Red fox KINGDOM Animalia PHYLUM Chordata CLASS Mammalia ORDER Carnivora FAMILY Ursidae GENUS Ursus SPECIES Ursus arctos
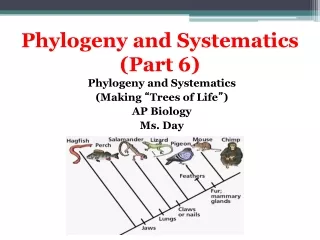
Phylogenetic Systematics • Phylogenetic Tree – reflect the hierarchical classification of taxonomic groups • Cladogram – a “tree” constructed from a series of dichotomies, or 2-way branch points that represent divergence of an animal from a common ancestor; the “deeper” the branch to greater the divergence • The sequence symbolizes historical chronology • Clades – each branch in a cladogram; ancestral species and all of its decendents
How Do We Construct a Cladogram? • Homology – likeness attributed to shared ancestry; all forelimbs of mammals are homologous • Not all likeness qualifies as homology • Convergent Evolution – Species from different evolutionary branches may come to resemble one another if they have similar ecologocial roles and natural selection has shaped analogous adaptation. Similarity due to convergence is called analogy. • Example – the wings of a bird, bat, and bee.
Convergent Evolution & Analogous Structures Alluaudia of Madagascar Ocotillo of southwestern North America
How Do We Construct a Cladogram? • As a general rule – the greater the number of homologous parts between two species, the more closely the species are related. • The more complex two similar structures are, the less likely it is they evolved independently • Example – the human skull and chimpanzee skull match almost perfectly bone for bone, the only difference is the way they fuse together. Most likely, the genes required to build these skulls were inherited from a common ancestor.
Identifying Shared Derived Characteristics These characteristics allow us to identify the sequence in which derived characters evolved during vertebrate phylogeny
Phylogeny Can Be Inferred From Molecular Data • Anatomical characteristics and homology alone cannot account for all evolutionary relationships • Systematists compare genes (DNA) and gene products (proteins) to determine evolutionary relationships
Appendages Conical Shells Crustaceans Gastropod Crab Crab Limpet Limpet Barnacle Barnacle Molted exoskeleton Segmentation TRADITIONAL CLASSIFICATION CLADOGRAM Phylogeny Can Be Inferred From Molecular Data
And now that we have finished… RE-READ YOUR REMARKS AT THE BEGINNING OF THE UNIT ON EVERYTHING YOU BELIEVE TO BE TRUE ABOUT EVOLUTION…….. HAS YOUR PERSPECTIVE CHANGED GIVEN THE INFORMATION PRESENTED TO YOU IN THIS UNIT?