Download
1 / 17
170 likes | 199 Views
Learn about different types of errors in lab data, the concepts of accuracy, precision, deviation, and how to calculate them mathematically for better understanding and analysis in scientific experiments.

E N D
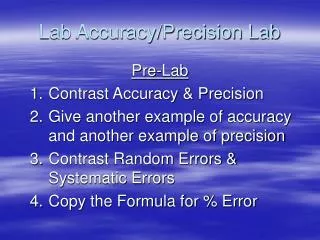
Common misconception: • Any mistake in a lab is considered Error? • NOT TRUE, lab Error does NOT include calculating wrong, measuring wrong, etc…
TYPES OF ERRORS: Systematic & Random • Systematic Error • Produces an error that is always the same. Either always high or always low.
TYPES OF SYSTEMATIC ERROR • INSTRUMENTAL ERROR • caused by faulty inaccurate equipment, use in labs • PERSONAL ERROR • caused by some peculiarity or bias of the observer—notacceptable in labs, these are “mistakes” • EXTERNAL ERROR • caused by external conditions, use in labs if applicable
TYPES OF ERRORS • RANDOM ERROR: • Errors that are due solely to chance. They will produce errors that are both above and below the accepted value. • Random errors cannot be corrected but can be minimized by doing a large number of observations • Random error always is present
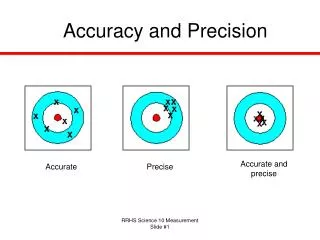
ACCURACY • The closeness of a measurement to the accepted value for a specific physical quantity
ACCURACY is represented MATHEMATICALLY as ERROR (Relative) or % Difference Mean Experimental Value Absolute Error Accepted Value Absolute Error Relative Error Accepted Value
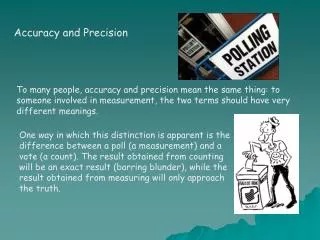
Percent Difference (%Diff) • When comparing twovalues or sets of Data to determine error between them, the calculation is called percent difference First calculate the average if using sets of data
PRECISION • The agreement of several measures that have been made in the same way with each other • It is also how exact an instrument can measure
PRECISION is represented MATHEMATICALLY as DEVIATION (Relative) Each Observed Experimental Value Absolute Deviation done for each measurement Mean Experimental Value Average Absolute Deviation Relative Deviation Mean Experimental Value
8.93 m/sec 9.36 m/sec 10.48 m/sec 9.15 m/sec 9.33 m/sec 47.25 m/sec Absolute and Relative Error First: CALCULATE THE AVERAGE
ABSOLUTE ERROR RELATIVE ERROR
Absolute Deviations Absolute and Relative Deviation
0.52 m/s 0.09 m/s 1.03 m/s 0.30 m/s 0.12 m/s 2.06 m/s Absolute and Relative Deviation AVERAGE ABSOLUTE DEVIATION DA
Explain the difference between: Accuracy and Precision Aka Error and Deviation You should be able to: In a lab, be able to calculate Error % or % Difference and Deviation % when needed.