Download
1 / 23
230 likes | 330 Views
Study on detecting natural image boundaries with brightness, color, and texture cues. Learn probability of boundaries, apply image features, texton distribution, gradient-based features, optimization, cue combination, and classifier comparison. Evaluation with precision-recall curve and F-measure.

E N D
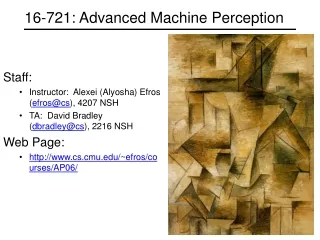
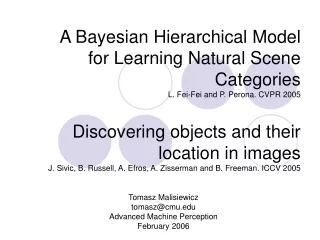
Learning to Detect Natural Image Boundaries Using Local Brightness, Color and Texture Cuesby David R. Martin, Charless C. Fowlkes, Jitendra Malik Heather Dunlop 16-721: Advanced Perception January 25, 2006
Human Canny Martin, 2002 What is a Boundary?
Dataset “You will be presented a photographic image. Divide the image into some number of segments, where the segments represent ‘things’ or ‘parts of things’ in the scene. The number of segments is up to you, as it depends on the image. Something between 2 and 30 is likely to be appropriate. It is important that all of the segments have approximately equal importance.”
Dataset • Database of over 1000 images and 5-10 segmentations for each Martin, 2002
Boundaries Non-boundaries Boundaries Intensity Brightness Color Texture Martin, 2002
Image Boundary Strength Optimized Cues Cue Combination Brightness Model Color Texture Benchmark Human Segmentations Method • Goal: learn the probability of a boundary, Pb(x,y,θ) Martin, 2002
Image Features • CIE L*a*b* color space (luminance, red-green, yellow-blue) • Oriented Energy: • fe: Gaussian second derivative • fo: Its Hilbert transform • Brightness • L* distribution • Color • a* and b* distributions (joint or marginal) • Texture
Texture • Convolve with a filter bank: • Gaussian second derivative • Its Hilbert transform • Difference of Gaussians • Filter responses give a measure of texture
Other Filter Banks Leung-Malik filter set: Schmid filter set: Maximum Response 8 filter set:
Textons • Convolve image with filter bank • Cluster filter responses to form textons Adapted from Martin, 2002 and Varma, Zisserman, 2005
Texton Distribution • Assign each pixel to nearest texton • Form distribution of textons Adapted from Martin, 2002 and Varma, Zisserman, 2005
r (x,y) Gradient-based Features • Brightness (BG), color (CG), texture (TG) gradients • Half-disc regions described by histograms • Compare distributions with χ2 statistic
Texture Gradient • Texton distribution in two half circles Martin, 2002
Localization • Tightly localize boundaries • Reduce noise • Coalesce double detections • Improve OE and TG features OE OE localized TG TG localized Martin, Fowlkes, Malik, 2004
Optimization • Texture parameters: • type of filter bank • scale of filters • number of textons • universal or image-specific textons • Other possible distance/histogram comparison metrics • Number of bins for histograms • Scale parameter for all cues
Evaluation Methodology • Posterior probability of boundary: Pb(x,y,θ) • Evaluation measure: precision recall curve • F-measure: Martin, 2002
Cue Combination • Which cues should be used? • OE is redundant when other cues are present • BG+CG+TG produces best results Martin, 2002
Classifiers • Until now, only logistic regression was used • Other possible classifiers: • Density estimation • Classification trees • Hierarchical mixtures of experts • Support vector machines Martin, 2002
Result Comparison • Alternative methods: • Matlab’s Canny edge detector with and without hysteresis • Spatially-averaged second moment matrix (2MM) Martin, 2002
Image Canny 2MM BG+CG+TG Human Results Martin, 2002
Image Canny 2MM BG+CG+TG Human Results Martin, 2002
Image Canny 2MM BG+CG+TG Human Results Martin, 2002
Conclusions • Large data set used for testing • Texture gradients are a powerful cue • Simple linear model sufficient for cue combination • Outperforms existing methods • An approach that is useful for higher-level algorithms • Code is available online: http://www.eecs.berkeley.edu/Research/Projects/CS/vision/grouping/segbench/