Download
1 / 17
170 likes | 241 Views
Measuring Network Security Using Attack Graphs. Anoop Singhal National Institute of Standards and Technology Coauthors: Lingyu Wang and Sushil Jajodia Concordia University George Mason University Metricon ’ 07. Outline. Background and Related Work Application Examples

E N D
Measuring Network Security Using Attack Graphs Anoop Singhal National Institute of Standards and Technology Coauthors: Lingyu Wang and Sushil Jajodia Concordia University George Mason University Metricon’07
Outline • Background and Related Work • Application Examples • Attack Resistance Metric • Conclusion and Future Work
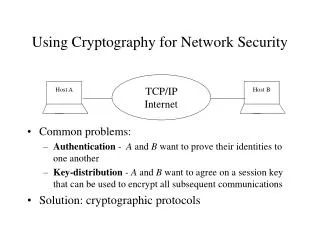
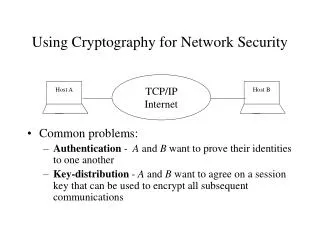
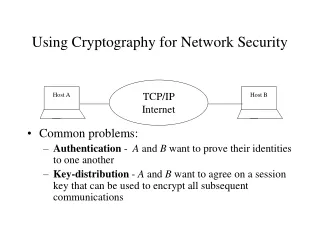
Motivation • Typical issues addressed in the literature • Is that database server secure from intruders? • Can the database server be secured from intruders? • How do I stop an ongoing intrusion? • Notice that they all have a qualitative nature • Better questions to ask: • How secure is the database server? • How much security does a new configuration provide? • What is the least-cost option to stop the attack? • For this we need a network security metric
Challenges • Measuring each vulnerability • Impact, exploitability, etc. • Temporal, environmental factors • E.g., the Common Vulnerability Scoring System (CVSS) v2 released on June 20, 20071 • Composing such measures for the overall security of a network • Our work focuses on this problem
Related Work • NIST’s efforts on standardizing security metric • Special publication 500-133 1985, 800-55 2003 • NVD and CVSSv2 • Markov model and MTTF for security • Dacier et. al TSE 1999 • Minimum-effort approaches • Balzarotti et. al QoP’05 • Pamula et. al QoP’06 • Attack surface (Howard et. al QoP’06) • PageRank (Mehta et. Al RAID’06)
Related Work (Cont’d) • Attack graph • Model checker-based (Ritchey et. al S&P’00, Sheyner et. al S&P’02) • Graph-based (Ammann et. al CCS’02, Ritchey et. al ACSAC’02, Noel et. al ACSAC’03, Wang et. al ESORICS’05, Wang et. al DBSEC’06)
Attack Graph • To measure combined effect of vulnerabilities • We need to understand the interplay between them • How can an attacker combine them for an intrusion • Attack graph is a model of potential sequences of attacks compromising given resources
Numbers are estimated probabilities of occurrence for individual exploits, based on their relative difficulty. The ftp_rhosts and rsh exploits take advantage of normal services in a clever way and do not require much attacker skill A bit more skill is required for ftp_rhosts in crafting a .rhost file. sshd_bof and local_bof are buffer-overflow attacks, which require more expertise. Attack Graph with Probabilities
When one exploit must follow another in a path, this means both are needed to eventually reach the goal, so their probabilities are multiplied: p(A and B) = p(A)p(B) When a choice of paths is possible, either is sufficient for reaching the goal: p(A or B) = p(A) + p(B) –p(A)p(B). Probabilities Propagated Through Attack Graph
Network Hardening • When we harden the network, this changes the attack graph, along with the way its probabilities are propagated. • Our options are to block traffic from the Attacker: • Make no change to the network (baseline) • Block ftp traffic to prevent ftp_rhosts(0,1) and ftp_rhosts(0,2) • Block rsh traffic to prevent rsh(0,1) and rsh(0,2) • Block ssh traffic to prevent sshd_bof(0,1)
Comparison of Options • We can make comparisons of relative security among the options • Blocking ftp traffic from Attacker leaves a remaining 4-step attack path with total probability p = 0.1∙0.8∙0.9∙0.1 = 0.0072 • Blocking rsh traffic leaves the same 4-step attack path • But blocking ssh traffic leaves 2 attack paths, with total probability p ≈ 0.0865, i.e., compromise is 10 times more likely with this option.
A Generic Attack Resistance Metric • Given an attack graph G(EC,ReqImp), define • r(): E D, • R(): E D • and : D D D • D is the domain of attack resistance • For any exploit e • r(e) is its individual resistance, and • R(e) is the cumulative resistance
A Generic Attack Resistance Metric • and are two operators used to calculate cumulative resistances from individual resistances • Corresponding to the disjunctive and conjunctive dependency relationships between exploits, respectively
Conclusion • Based on attack graphs, we have proposed a metric for measuring the overall security of networks • The metric meets intuitive requirements derived from common senses • The metric can be instantiated for different applications, and it generalizes previous proposals
Future Work • Study of metric for other aspects of network security, e.g., risk and cost • Applying the metric to vulnerability analysis, network hardening, etc.