Download
1 / 24
240 likes | 428 Views
Needles in the migraine haystack, cerebrospinal fluid biomarkers. Company: Huntington Medical Research Institutes Mentors: Alfred Fonteh Ph.D., Mike Harrington M.B. Ch.B., F.R.C.P. Intern: Samuel Wein Earlham College, IN. USA. Uncovering the protein changes brought about by migraine.

E N D
Needles in the migraine haystack, cerebrospinal fluid biomarkers Company: Huntington Medical Research Institutes Mentors: Alfred Fonteh Ph.D., Mike Harrington M.B. Ch.B., F.R.C.P. Intern: Samuel Wein Earlham College, IN. USA
Uncovering the protein changes brought about by migraine Goal: To process MS/MS data to graph the levels of proteins from cerebrospinal fluid (CSF) during migraine and then combine these graphs with protein protein interaction data to create a map of expressions.
Why do we care? • Chronic Migraine is a debilitating disorder affecting as many as 10% of people • Migraine has a direct medical cost of over $1 billion dollars • By understanding how the brain changes during migraine we come closer to finding better treatments • CSF is a likely pool for biomarkers as it is within the blood brain barrier
What is migraine? • A neurological disorder which manifests in severe headaches, photophobia, phonophobia, and nausea • Caused by over-excitation of various nerves
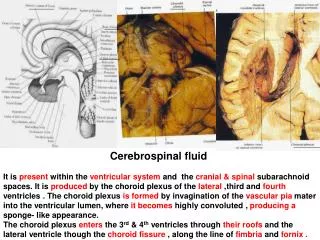
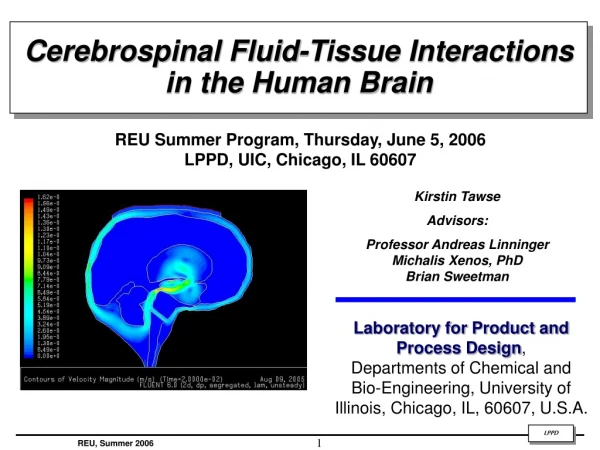
What is CSF? • Produced in the brain • Pushed down spinal column where it is absorbed • Physically protects the brain • Acts as a conduit for signals
What I am doing Taking protein sequence data from CSF samples taken over a four day period Using existing databases to find how the proteins interact Mapping expression levels of each protein every day onto their interactions Grouping proteins by expression profile over time Grouping proteins by presence in specific pathways
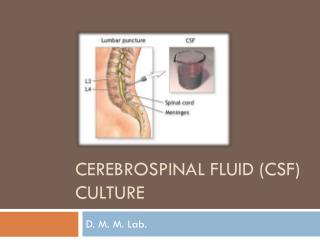
Protein sequence data • Data was collected from a stent inserted into the spinal column • CSF was harvested every four hours • Protein sequence was obtained using liquid chromatography and mass spectrometry
MS/MS data • Proteins were digested with trypsin • MS/MS data was interpreted using BioWorks • SEQUEST algorithm was used to determine protein composition as well as frequency of protein appearance • Protein abundance was measured by height of peaks
CSV file with Protein namenumber of expressions Protein similarities Raw Ms/MsData Parser Interactionsbetweenproteins VANTED Return SeparatedList of Protein names APID2Net& Cytoscape Final Graph PICR List ofsynonyms
Python & Shell Scripts • Used to convert between different formats • Populate VANTED templates • Creates a list of proteins
CSV file with Protein namenumber of expressions Protein similarities Raw Ms/MsData Parser Interactionsbetweenproteins VANTED Return SeparatedList of Protein names APID2Net& Cytoscape Final Graph PICR List ofsynonyms
CSV file with Protein namenumber of expressions Protein similarities Raw Ms/MsData Parser Interactionsbetweenproteins VANTED Return SeparatedList of Protein names APID2Net& Cytoscape Final Graph PICR List ofsynonyms
Apid2NET • Proteins are tagged based upon what known pathways they participate in • Can also be tagged by structural homology
CSV file with Protein namenumber of expressions Protein similarities Raw Ms/MsData Parser Interactionsbetweenproteins VANTED Return SeparatedList of Protein names APID2Net & Cytoscape Final Graph PICR List ofsynonyms
PICR • Protein identifier cross-reference service • Finds synonyms of protein names and uniprot numbers
CSV file with Protein namenumber of expressions Protein similarities Raw Ms/MsData Parser Interactionsbetweenproteins VANTED Return SeparatedList of Protein names APID2Net& Cytoscape Final Graph PICR List ofsynonyms
VANTED • Links represent known protein interactions • Colors represent similar expression profiles • Line graphs show the expression levels
A schematic procedure CSV file with Protein namenumber of expressions Protein similarities Raw Ms/MsData Parser Interactionsbetweenproteins VANTED Return SeparatedList of Protein names APID2Net & Cytoscape Final Graph PICR List ofsynonyms
Conclusion Automated generation of protein expression graphs Automated ability to search protein functions These tools will be invaluable in searching the migraine haystack
Thanks and acknowledgements Drs Fonteh and Harrington HMRI All of the SocalBSI staff All of my fellow students NSF and NIH