Download

1 / 31
310 likes | 490 Views
MsTMIP Driver Data Sets. Model Simulation Requirements. Global Spatial Extent: W: -180.0, S: -90.0, E: 180.0, N: 90.0 Spatial Resolution: 0.5 degree North America Spatial Extent: W: -170.0, S: 10.0, E: -50.0, N: 84.0 Spatial Resolution: 0.25 degree. Overview of Driver Data Sets.

E N D
Model Simulation Requirements • Global • Spatial Extent: • W: -180.0, S: -90.0, E: 180.0, N: 90.0 • Spatial Resolution: 0.5 degree • North America • Spatial Extent: • W: -170.0, S: 10.0, E: -50.0, N: 84.0 • Spatial Resolution: 0.25 degree
Overview of Driver Data Sets ftp://nacp.ornl.gov/synthesis/2009/frescati/model_driver/
Climate - CRUNCEP • Global: CRUNCEP (Philippe and Nicolas) • Temporal Resolution/Extent: 6-hourly / 1901-2010 • Variables ftp://nacp.ornl.gov/synthesis/2009/frescati/model_driver/cru_ncep/
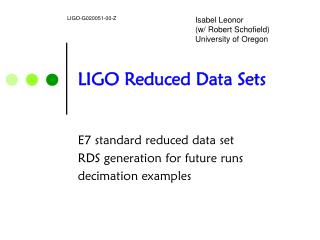
Climate - CRUNCEP Temperature at 2m on 2000-07-26, 12pm – 15pm GMT
Climate - NARR • North America: NARR • Temporal Resolution/Extent: 3-hourly / 1979-2010 • Variables ftp://nacp.ornl.gov/synthesis/2009/frescati/model_driver/narr/
Climate - NARR • Special Processings for NARR • Wind Speed • Computed from U-wind and V-wind • Reprojection • Conservative for precip and radiation • Distance-weighted average for other variables • Precipitation Rescaled with GPCP v2.1 • Year 2010 precip not rescaled • dswrf reanalyzed with MTCLIM algorithm • Year 2010 dswrf not reanalyzed
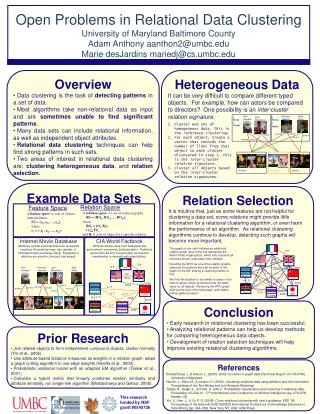
Climate - NARR NARR long term mean annual total precipitation before (left) and after (right) rescaling with GPCP NARR 3-hourly (1979-05-18, 3pm-5pm GMT) downward shortwave radiation flux before (left) and after (right) reanalysis with MTCLIM algorithm
Land Mask - Global • Global: CRUNCEP Land Mask CRUNCEP Land Water Mask for Global ftp://nacp.ornl.gov/synthesis/2009/frescati/model_driver/land_water_mask/
Land Mask - NA • North America – NARR Land Mask NARR Land Water Mask for North America ftp://nacp.ornl.gov/synthesis/2009/frescati/model_driver/land_water_mask/
Land Mask - NA • Special Processings for NARR Land Mask • Reprojection • Threshold 50% was used to convert fraction to mask
Phenology – Global & NA • Global & NA: GIMMSg (Kevin) • Temporal Resolution/Extent: monthly / one year • Variables ftp://nacp.ornl.gov/synthesis/2009/frescati/model_driver/phenology/
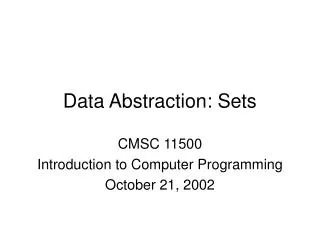
Phenology – Global & NA • Special Processing • Missing values on land were filled to match the global/NA land mask. Global LAI in June North America fPAR in June
CO2 Concentration – Global & NA • Global & NA: Enhanced GlobalView (Andy) • Temporal Resolution/Extent: monthly / 1700 - 2009 Global CO2 Concentration in 2009-02 North America CO2 Concentration in 2008-06 ftp://nacp.ornl.gov/synthesis/2009/frescati/model_driver/co2_concentration/
CO2 Concentration – Global & NA • Description for CO2 Concentration • The data is exactly GlobalView from 1979-2009. • It agrees well with Scripps CO2 at the South Pole and Mauna Loa from 1957-2009. • The annual cycle as a function of latitude prior to 1979 is set to the Globalview 8-harmonic “average” seasonal cycle. • It agrees with the Macfarling-Meure Law Dome ice core record of CO2 in Antarctica from 1700-19xx. • The MLO-SPO annual-mean gradient from GlobalView is modeled as a function of FF emissions from Marland et al. This particular model follows on Conway and Tans (GBC, 1999) and has a preindustrial interhemispheric gradient of 0 ppm. (There are many devilish details in this step)
Biome Classification – Global & NA • Global & NA: SYNMAP (Martin) • Temporal Resolution/Extent: one time • Variables ftp://nacp.ornl.gov/synthesis/2009/frescati/model_driver/biome/
SYNMAP Biome Types Value Life forms Tree leaf type Tree leaf longevity % land 1 Trees Needle Evergreen 9.8 2 Trees Needle Deciduous 1.7 3 Trees Needle Mixed 0.6 4 Trees Broad Evergreen 8.2 5 Trees Broad Deciduous 3 6 Trees Broad Mixed 0.5 7 Trees Mixed Evergreen 0.25 8 Trees Mixed Deciduous 0.03 9 Trees Mixed Mixed 3.5 10 Trees & Shrubs Needle Evergreen 1.5 11 Trees & Shrubs Needle Deciduous 0.2 12 Trees & Shrubs Needle Mixed 0.05 13 Trees & Shrubs Broad Evergreen 0.3 14 Trees & Shrubs Broad Deciduous 2.5 15 Trees & Shrubs Broad Mixed 0.2 16 Trees & Shrubs Mixed Evergreen 0.03 17 Trees & Shrubs Mixed Deciduous 0.04 18 Trees & Shrubs Mixed Mixed 0.3 19 Trees & Grasses Needle Evergreen 0.2 20 Trees & Grasses Needle Deciduous 0.03 21 Trees & Grasses Needle Mixed 0.01 22 Trees & Grasses Broad Evergreen 0.3 23 Trees & Grasses Broad Deciduous 2.15 24 Trees & Grasses Broad Mixed 0.15 25 Trees & Grasses Mixed Evergreen 0.005 26 Trees & Grasses Mixed Deciduous 0.02 27 Trees & Grasses Mixed Mixed 0.2 28 Trees & Crops Needle Evergreen 0.3 29 Trees & Crops Needle Deciduous 0.006 30 Trees & Crops Needle Mixed 0.003 31 Trees & Crops Broad Evergreen 0.7 32 Trees & Crops Broad Deciduous 1.1 33 Trees & Crops Broad Mixed 0.2 34 Trees & Crops Mixed Evergreen 0.01 35 Trees & Crops Mixed Deciduous 0.01 36 Trees & Crops Mixed Mixed 0.4 37 Shrubs - - 4.5 38 Shrubs & Grasses - - 8.3 39 Shrubs & Crops - - 0.4 40 Shrubs & Barren - - 10.5 41 Grasses - - 8.3 42 Grasses & Crops - - 1.5 43 Grasses & Barren - - 0.3 44 Crops - - 10.7 45 Barren - - 11.7 46 Urban - - 0.2 47 Snow & Ice - - 5.2 0 = water
Biome Classification – Global & NA • Special Processing • Missing values on land were filled to match the global/NA land mask. Global Cropland Fraction
Nitrogen Deposition – Global & NA • Global & NA: Enhanced Dentener (Hanqin and Crystal) • Temporal Resolution/Extent: yearly / 1860 - 2050 • Variables ftp://nacp.ornl.gov/synthesis/2009/frescati/model_driver/nitrogen/
Nitrogen Deposition – Global & NA • Special Processing • Between 1890-1990, the annual variation of nitogen deposition rate was controlled by EDGAR-HYDE 1.3 • Betwee 1990-2050, nitrogen deposition was assumed to increase linearly Mean annual nitrogen deposition rate (mg N/m2/yr) across the land surface of global (left) and North America (right) during 1860-2050
Nitrogen Deposition – Global & NA Global NHx-N Deposition in 1900 (left) and 2000 (right) North America NOy-N Deposition in 1900 (left) and 2000 (right)
Soil - Global • Global: HWSD v1.1 • Variables (next page) • Special processing • Missing values on land were filled by Kevin to match the global land mask. Global Top Soil Layer Clay Fraction ftp://nacp.ornl.gov/synthesis/2009/frescati/model_driver/soil/
Soil - NA • NA: SSURGO (US) + Soil Landscapes of Canada version 3.2 + HWSD v1.1 (Mexico and Latin-America) • Variables (next page)
Variables United States
Variables Canada
Soil - NA • Special Processing • For each horizon, the original SSURGO database contains volume of 4 different sizes (2mm-5mm, 5mm-75mm, 75mm-250mm, 250mm-1000mm) of fragments. The processed fragments_volume variable is the total volume of these 4 sizes of fragments. • For each horizon, the original SSURGO database contains one or more textures. For example, a horizon that is gravelly loamy sand in some places and gravelly loamy coarse sand in other places is shown as GR-LS on one row and GR-LCOS on another row in this table. The row with the typically occurring texture is identified as the RV row. Stratified textures are shown in one row. For example, a horizon that is stratified gravelly loamy fine sand and cobbly coarse sand is shown as SR- GR-LFS CB-COS on one row and the Stratified? column for that row is marked "yes". If two or more textures always occur together but are not stratified, all of the textures are listed on one row and the “Stratified” column for that row is marked "no". The processed texture variable contains the typically occurring texture (if there is one row with RV marked as “Yes”) or a randomly chosen texture (if there is no row with RV marked as “Yes”). • US, Canada, Mexico soil data are merged together • Missing values on land were filled by Kevin to match the global land mask.
Land Use Change – Global & NA • Global & NA: Hurtt’s + RCP4.5 • Temporal Resolution/Extent: yearly / 1700 – 2010 • Variables • Annual land use state maps • Annual land use transition ftp://nacp.ornl.gov/synthesis/2009/frescati/model_driver/land_use_harmonization/
Data Format • CF-1.4 compatible netCDF format • CRS: Sphere Geographic Lat/Lon, R=6371200 • Coordinates: Lat/Lon for the center of pixels • Calendar: proleptic_gregorian • Leap Year: yes • Time Unit: days since1700-01-01T00:00:00Z • Bound information is provided for both coordinates and time dimensions • cell_methods attributes can be used to identify the representation of a data value: sum/average over spatial/temporal
Example NetCDF Header $ ncdump -h apcp_rescaled.2000.nc netcdf apcp_rescaled.2000 { dimensions: lon = 480 ; lat = 296 ; time = 2928 ; nv = 2 ; variables: char crs ; crs:grid_mapping_name = "latitude_longitude" ; crs:semi_major_axis = 6371200. ; crs:inverse_flattening = 0. ; double lon(lon) ; lon:standard_name = "longitude" ; lon:long_name = "longitude coordinate" ; lon:units = "degrees_east" ; lon:bounds = "lon_bnds" ; double lat(lat) ; lat:standard_name = "latitude" ; lat:long_name = "latitude coordinate" ; lat:units = "degrees_north" ; lat:bounds = "lat_bnds" ; double time(time) ; time:long_name = "time" ; time:units = "days since 1700-01-01T00:00:00Z" ; time:calendar = "proleptic_gregorian" ; time:bounds = "time_bnds" ; double lon_bnds(lon, nv) ; double lat_bnds(lat, nv) ; double time_bnds(time, nv) ; double apcp(time, lat, lon) ; apcp:long_name = "3-hourly accumulated total precipitation at Surface" ; apcp:units = "kg/m^2" ; apcp:cell_methods = "area: mean time: sum" ; apcp:_FillValue = -999. ; apcp:missing_value = -999. ; apcp:grid_mapping = "crs" ; // global attributes: :Conventions = "CF-1.4" ; :version = "1.0" ; }
Questions • Please contact Yaxing Wei at any time • Email: weiy@ornl.gov • Phone: 865-241-3403