Download
1 / 31
310 likes | 397 Views
TAU Performance System Framework helps evaluate adaptive scientific apps with scalable, parallel, high-performance computing. Includes tools for performance instrumentation, analysis, and visualization.

E N D
Performance Evaluation of Adaptive Scientific Applications using TAU Sameer Shende, Allen D. Malony, and Alan Morris {sameer, malony, amorris}@cs.uoregon.edu Steven Parker, and J. Davison de St. Germain {sparker, dav}@cs.utah.edu University of Oregon and University of Utah
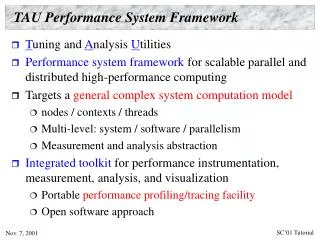
TAU Performance System Framework • Tuning and Analysis Utilities • Performance system framework for scalable parallel and distributed high-performance computing • Targets a general complex system computation model • nodes / contexts / threads • Multi-level: system / software / parallelism • Measurement and analysis abstraction • Integrated toolkit for performance instrumentation, measurement, analysis, and visualization • Portable, configurable performance profiling/tracing facility • Open software approach • University of Oregon, LANL, FZJ Germany • http://www.cs.uoregon.edu/research/paracomp/tau
TAU Performance System Architecture Paraver Jumpshot paraprof
Program Database Toolkit (PDT) • Program code analysis framework • develop source-based tools • High-level interface to source code information • Integrated toolkit for source code parsing, database creation, and database query • Commercial grade front-end parsers • Portable IL analyzer, database format, and access API • Open software approach for tool development • Multiple source languages • Implement automatic performance instrumentation tools • tau_instrumentor
Program Database Toolkit (PDT) Application / Library C / C++ parser Fortran parser F77/90/95 Program documentation PDBhtml Application component glue IL IL SILOON C / C++ IL analyzer Fortran IL analyzer C++ / F90/95 interoperability CHASM Program Database Files Automatic source instrumentation TAU_instr DUCTAPE
AutoInstrumentation using TAU_COMPILER • $(TAU_COMPILER) stub Makefile variable (v2.13.7+) • Invokes PDT parser, TAU instrumentor, compiler through tau_compiler.shshell script • Requires minimal changes to application Makefile • Compilation rules are not changed • User adds $(TAU_COMPILER) before compiler name • F90=mpxlf90Changes toF90= $(TAU_COMPILER) mpxlf90 • Passes options from TAU stub Makefile to the four compilation stages • Uses original compilation command if an error occurs
TAU_COMPILER – Improving Integration in Makefiles include /usr/tau-2.14.4/rs6000/Makefile.tau-mpi-pdt CXX = $(TAU_COMPILER) mpCC F90 = $(TAU_COMPILER) mpxlf90_r CFLAGS = LIBS =-lm OBJS = f1.o f2.o f3.o … fn.o app: $(OBJS) $(CXX) $(LDFLAGS) $(OBJS) -o $@ $(LIBS) .cpp.o: $(CC) $(CFLAGS) -c $<
TAU_COMPILER Commandline Options • See <taudir>/<arch>/bin/tau_compiler.sh –help • Compilation: % mpxlf90 -c foo.f90 Changes to% f95parse foo.f90 $(OPT1)% tau_instrumentor foo.pdb foo.f90 –o foo.inst.f90 $(OPT2)% mpxlf90 –c foo.f90 $(OPT3) • Linking: % mpxlf90 foo.o bar.o –o app Changes to% mpxlf90 foo.o bar.o –o app $(OPT4) • Where options OPT[1-4] default values may be overridden by the user: F90 = $(TAU_COMPILER) $(MYOPTIONS) mpxlf90
Overriding Default Options:TAU_COMPILER include /usr/common/acts/TAU/tau-2.14.4/rs6000/lib/ Makefile.tau-mpi-pdt-trace MYOPTIONS= -optVerbose –optKeepFiles F90 = $(TAU_COMPILER) $(MYOPTIONS) mpxlf90 OBJS = f1.o f2.o f3.o … LIBS = -Lappdir –lapplib1 –lapplib2 … app: $(OBJS) $(F90) $(OBJS) –o app $(LIBS) .f90.o: $(F90) –c $<
Using TAU • Configuration • Instrumentation • Manual • MPI – Wrapper interposition library • PDT- Source rewriting for C,C++, F77/90/95 • OpenMP – Directive rewriting • Component based instrumentation – Proxy components • Binary Instrumentation • DyninstAPI – Runtime Instrumentation/Rewriting binary • Java – Runtime instrumentation • Python – Runtime instrumentation • Measurement • Performance Analysis
Profile Measurement – Three Flavors • Flat profiles • Time (or counts) spent in each routine (nodes in callgraph). • Exclusive/inclusive time, no. of calls, child calls • E.g,: MPI_Send, foo, … • Callpath Profiles • Flat profiles, plus • Sequence of actions that led to poor performance • Time spent along a calling path (edges in callgraph) • E.g., “main=> f1 => f2 => MPI_Send” shows the time spent in MPI_Send when called by f2, when f2 is called by f1, when it is called by main. Depth of this callpath = 4 (TAU_CALLPATH_DEPTH environment variable) • Phase based profiles • Flat profiles, plus • Flat profiles under a phase (nested phases are allowed) • Default “main” phase has all phases and routines invoked outside phases • Supports static or dynamic (per-iteration) phases • E.g., “IO => MPI_Send” is time spent in MPI_Send in IO phase
TAU Timers and Phases • Static timer • Shows time spent in all invocations of a routine (foo) • E.g., “foo()” 100 secs, 100 calls • Dynamic timer • Shows time spent in each invocation of a routine • E.g., “foo() 3” 4.5 secs, “foo 10” 2 secs (invocations 3 and 10 respectively) • Static phase • Shows time spent in all routines called (directly/indirectly) by a given routine (foo) • E.g., “foo() => MPI_Send()” 100 secs, 10 calls shows that a total of 100 secs were spent in MPI_Send() when it was called by foo. • Dynamic phase • Shows time spent in all routines called by a given invocation of a routine. • E.g., “foo() 4 => MPI_Send()” 12 secs, shows that 12 secs were spent in MPI_Send when it was called by the 4th invocation of foo.
Static Timers in TAU SUBROUTINE SUM_OF_CUBES integer profiler(2) save profiler INTEGER :: H, T, U call TAU_PROFILE_TIMER(profiler, 'SUM_OF_CUBES') call TAU_PROFILE_START(profiler) ! This program prints all 3-digit numbers that ! equal the sum of the cubes of their digits. DO H = 1, 9 DO T = 0, 9 DO U = 0, 9 IF (100*H + 10*T + U == H**3 + T**3 + U**3) THEN PRINT "(3I1)", H, T, U ENDIF END DO END DO END DO call TAU_PROFILE_STOP(profiler) END SUBROUTINE SUM_OF_CUBES
Static Phases and Timers SUBROUTINE FOO integer profiler(2) save profiler call TAU_PHASE_CREATE_STATIC(profiler, ‘foo') call TAU_PHASE_START(profiler) call bar() ! Here bar calls MPI_Barrier and we evaluate foo=>MPI_Barrier and foo=>bar call TAU_PHASE_STOP(profiler) END SUBROUTINE SUM_OF_CUBES SUBROUTINE BAR integer profiler(2) save profiler call TAU_PROFILE_TIMER(profiler, ‘bar’) call TAU_PROFILE_START(profiler) call MPI_Barrier() call TAU_PROFILE_STOP(profiler) END SUBROUTINE BAR
Dynamic Phases SUBROUTINE ITERATE(IER, NIT) IMPLICIT NONE INTEGER IER, NIT character(11) taucharary integer tauiteration / 0 / integer profiler(2) / 0, 0 / save profiler, tauiteration write (taucharary, '(a8,i3)') 'ITERATE ', tauiteration ! Taucharary is the name of the phase e.g.,‘ITERATION 23’ tauiteration = tauiteration + 1 call TAU_PHASE_CREATE_DYNAMIC(profiler,taucharary) call TAU_PHASE_START(profiler) IER = 0 call SOLVE_K_EPSILON_EQ(IER) ! Other work call TAU_PHASE_STOP(profiler)
Static Phases MPI_Barrier took 4.85 secs out of 13.48 secs in the DTM Phase
Dynamic Phases The first iteration was expensive for INT_RTE. It took 27.89 secs. Other iterations took less time – 14.2, 10.5, 10.3, 10.5 seconds
Dynamic Phases Time spent in MPI_Barrier, MPI_Recv,… in DTM ITERATION 1 Breakdown of time spent in MPI_Isend based on its static and dynamic parent phases
Case Study: Uintah Computational Framework ∑ Heptane fire simulation Typical C-SAFE simulation with a billion degrees of freedom and non-linear time dynamics Material stress simulation
C-SAFE Problem Specification High Level Architecture Scheduler Subgrid Model Chemistry Database Controller Chemistry Databases Mixing Model Numerical Solvers Fluid Model Simulation Controller High Energy Simulations Material Properties Database Numerical Solvers MPM Post Processing And Analysis Parallel Services Non-PSE Components Data Manager Resource Management Implicitly Connected to All Components Visualization Performance Analysis UCF Database Data PSE Components Checkpointing Control / Light Data Blazer Uintah Parallel Component Architecture
Parallel CFD Frameworks using TAU • Virtual Test Facility (VTF) [Caltech, ASC Center] • MFIX [NETL] • Earth System Modeling Framework (ESMF) [UCAR,NASA,ANL, …] • SAMRAI [LLNL] • S3D [Sandia, UMD, U.Michigan, …] • GrACE [Rutgers] • Miranda [LLNL] • SAGE [SAIC] • FLASH2 [U. Chicago, ASC Flash Center] • Uintah Computational Framework [ASC C-SAFE Center, U. Utah] …
TAU Performance System Status • Computing platforms (selected) • IBM SP / pSeries/BGL, SGI Origin 2K/3K, Cray T3E / SV-1 / X1, HP (Compaq) SC (Tru64), Sun, Hitachi SR8000, NEC SX-5/6, Linux clusters (IA-32/64, Alpha, PPC, PA-RISC, Power, Opteron), Apple (G4/5, OS X), Windows • Programming languages • C, C++, Fortran 77/90/95, HPF, Java, OpenMP, Python • Thread libraries • pthreads, SGI sproc, Java,Windows, OpenMP, Charm++ • Compilers (selected) • Intel KAI (KCC, KAP/Pro), PGI, GNU, Fujitsu, Sun, Microsoft, SGI, Cray, IBM (xlc, xlf), Compaq, NEC, Intel
Concluding Remarks • Complex parallel systems and software pose challenging performance analysis problems that require robust methodologies and tools • Introduced new measurement techniques in TAU for evaluating performance of adaptive scientific applications • Support for static and dynamic timers and phases • Application to the Uintah Computational Framework (U. Utah) • To build more sophisticated performance tools, existing proven performance technology must be utilized • TAU performance system offers robust performance technology that can be broadly integrated
Support Acknowledgements • Department of Energy (DOE) • Office of Science contracts • University of Utah DOE ASC Level 1 sub-contract • DOE ASC/NNSA Level 3 contract • NSF Software and Tools for High-EndComputing Grant • Research Centre Juelich • John von Neumann Institute for Computing • Dr. Bernd Mohr • Los Alamos National Laboratory