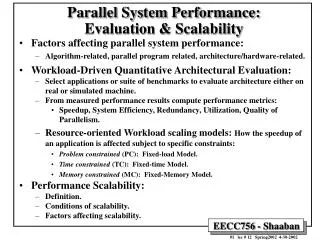
Parallel Performance Evaluation using the TAU Performance System Project
This project workshop discusses the TAU Performance System, a framework for evaluating the performance of parallel computing systems. The workshop covers the system's design, architecture, instrumentation, and measurement approaches. It also highlights the system's goals, including portability, support for multiple programming languages and paradigms, and scalability.

Parallel Performance Evaluation using the TAU Performance System Project
E N D
Presentation Transcript
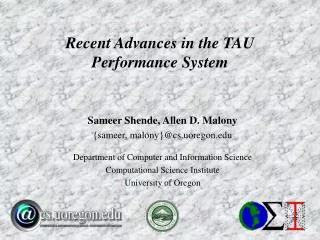
Parallel Performance Evaluation using theTAU Performance System Project Workshop on Performance Tools for Petascale Computing 9:30 – 10:30am, Tuesday, July 17, 2007, Snowbird, UT Sameer S. Shende sameer@cs.uoregon.edu http://www.cs.uoregon.edu/research/tau Performance Research Laboratory University of Oregon
Acknowledgements • Dr. Allen D. Malony, Professor • Alan Morris, Senior software engineer • Wyatt Spear, Software engineer • Scott Biersdorff, Software engineer • Kevin Huck, Ph.D. student • Aroon Nataraj, Ph.D. student • Brad Davidson, Systems administrator
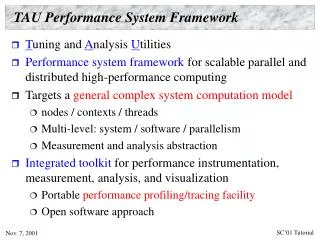
TAU Performance System • Tuning and Analysis Utilities (15+ year project effort) • Performance system framework for HPC systems • Integrated, scalable, flexible, and parallel • Targets a general complex system computation model • Entities: nodes / contexts / threads • Multi-level: system / software / parallelism • Measurement and analysis abstraction • Integrated toolkit for performance problem solving • Instrumentation, measurement, analysis, and visualization • Portable performance profiling and tracing facility • Performance data management and data mining • Partners: LLNL, ANL, LANL, Research Center Jülich
TAU Parallel Performance System Goals • Portable (open source) parallel performance system • Computer system architectures and operating systems • Different programming languages and compilers • Multi-level, multi-language performance instrumentation • Flexible and configurable performance measurement • Support for multiple parallel programming paradigms • Multi-threading, message passing, mixed-mode, hybrid, object oriented (generic), component-based • Support for performance mapping • Integration of leading performance technology • Scalable (very large) parallel performance analysis
TAU Instrumentation Approach • Support for standard program events • Routines, classes and templates • Statement-level blocks • Support for user-defined events • Begin/End events (“user-defined timers”) • Atomic events (e.g., size of memory allocated/freed) • Selection of event statistics • Support definition of “semantic” entities for mapping • Support for event groups (aggregation, selection) • Instrumentation optimization • Eliminate instrumentation in lightweight routines
TAU Instrumentation Mechanisms • Source code • Manual (TAU API, TAU component API) • Automatic (robust) • C, C++, F77/90/95 (Program Database Toolkit (PDT)) • OpenMP (directive rewriting (Opari), POMP2 spec) • Object code • Pre-instrumented libraries (e.g., MPI using PMPI) • Statically-linked and dynamically-linked • Executable code • Dynamic instrumentation (pre-execution) (DynInstAPI) • Virtual machine instrumentation (e.g., Java using JVMPI) • TAU_COMPILER to automate instrumentation process
User-level abstractions problem domain linker OS Multi-Level Instrumentation and Mapping • Multiple interfaces • Information sharing • Between interfaces • Event selection • Within/between levels • Mapping • Associate performance data with high-level semantic abstractions source code instrumentation preprocessor instrumentation source code instrumentation compiler instrumentation object code libraries executable instrumentation instrumentation runtime image instrumentation instrumentation VM performancedata run
TAU Measurement Approach • Portable and scalable parallel profiling solution • Multiple profiling types and options • Event selection and control (enabling/disabling, throttling) • Online profile access and sampling • Online performance profile overhead compensation • Portable and scalable parallel tracing solution • Trace translation to OTF, EPILOG, Paraver, and SLOG2 • Trace streams (OTF) and hierarchical trace merging • Robust timing and hardware performance support • Multiple counters (hardware, user-defined, system) • Performance measurement for CCA component software
TAU Measurement Mechanisms • Parallel profiling • Function-level, block-level, statement-level • Supports user-defined events and mapping events • TAU parallel profile stored (dumped) during execution • Support for flat, callgraph/callpath, phase profiling • Support for memory profiling (headroom, malloc/leaks) • Support for tracking I/O (wrappers, Fortran instrumentation of read/write/print calls) • Tracing • All profile-level events • Inter-process communication events • Inclusion of multiple counter data in traced events
Types of Parallel Performance Profiling • Flatprofiles • Metric (e.g., time) spent in an event (callgraph nodes) • Exclusive/inclusive, # of calls, child calls • Callpath profiles (Calldepth profiles) • Time spent along a calling path (edges in callgraph) • “main=> f1 => f2 => MPI_Send” (event name) • TAU_CALLPATH_DEPTH environment variable • Phase profiles • Flat profiles under a phase (nested phases are allowed) • Default “main” phase • Supports static or dynamic (per-iteration) phases
Performance Analysis and Visualization • Analysis of parallel profile and trace measurement • Parallel profile analysis • ParaProf: parallel profile analysis and presentation • ParaVis: parallel performance visualization package • Profile generation from trace data (tau2profile) • Performance data management framework (PerfDMF) • Parallel trace analysis • Translation to VTF (V3.0), EPILOG, OTF formats • Integration with VNG (Technical University of Dresden) • Online parallel analysis and visualization • Integration with CUBE browser (KOJAK, UTK, FZJ)
ParaProf Parallel Performance Profile Analysis Raw files HPMToolkit PerfDMFmanaged (database) Metadata MpiP Application Experiment Trial TAU
ParaProf – Flat Profile (Miranda, BG/L) node, context, thread 8K processors Miranda hydrodynamics Fortran + MPI LLNL Run to 64K
ParaProf – Callpath Profile (Flash) Flash thermonuclear flashes Fortran + MPI Argonne
ParaProf – Scalable Histogram View (Miranda) 8k processors 16k processors
ParaProf – 3D Full Profile (Miranda) 16k processors
ParaProf – 3D Scatterplot (S3D – XT3+XT4) • Each pointis a “thread”of execution • A total offour metricsshown inrelation • ParaVis 3Dprofilevisualizationlibrary • JOGL • I/O takes less time on one node (rank 0) • 6400 cores shown above
S3D Scatter Plot: Visualizing Hybrid XT3+XT4 • Red nodes are XT4, blue are XT3. 6400 cores allocated.
S3D: 6400 cores on XT3+XT4 System (Jaguar) • Gap represents XT3 nodes
Visualizing S3D Profiles in ParaProf • Gap represents XT3 nodes: MPI_Wait takes less time, other routines take more time.
Profile Snapshots in ParaProf Initialization Checkpointing Finalization
Profile Snapshots in ParaProf Filter snapshots (only show main loop iterations)
Profile Snapshots in ParaProf Breakdown as a percentage
Snapshot replay in ParaProf All windows dynamically update
Profile Snapshots in ParaProf Follow progression of various displays through time 3D scatter plot shown below T = 0s T = 11s
New automated metadata collection Multiple PerfDMF DBs
Performance Data Management: Motivation • Need for robust processing and storage of multiple profile performance data sets • Avoid developing independent data management solutions • Waste of resources • Incompatibility among analysis tools • Goals: • Foster multi-experiment performance evaluation • Develop a common, reusable foundation of performance data storage, access and sharing • A core module in an analysis system, and/or as a central repository of performance data
The PerfDMF Solution • Performance Data Management Framework • Originally designed to address critical TAU requirements • Broader goal is to provide an open, flexible framework to support common data management tasks • Extensible toolkit to promote integration and reuse across available performance tools • Supported profile formats: TAU, CUBE, Dynaprof, HPC Toolkit, HPM Toolkit, gprof, mpiP, psrun (PerfSuite), others in development • Supported DBMS: PostgreSQL, MySQL, Oracle, DB2, Derby/Cloudscape
K. Huck, A. Malony, R. Bell, A. Morris, “Design and Implementation of a Parallel Performance Data Management Framework,” ICPP 2005. PerfDMF Architecture
Recent PerfDMF Development • Integration of XML metadata for each profile • Common Profile Attributes • Thread/process specific Profile Attributes • Automatic collection of runtime information • Any other data the user wants to collect can be added • Build information • Job submission information • Two methods for acquiring metadata: • TAU_METADATA() call from application • Optional XML file added when saving profile to PerfDMF • TAU Metadata XML schema is simple, easy to generate from scripting tools (no XML libraries required)
Performance Data Mining (Objectives) • Conduct parallel performance analysis process • In a systematic, collaborative and reusable manner • Manage performance complexity • Discover performance relationship and properties • Automate process • Multi-experiment performance analysis • Large-scale performance data reduction • Summarize characteristics of large processor runs • Implement extensible analysis framework • Abstraction / automation of data mining operations • Interface to existing analysis and data mining tools
Performance Data Mining (PerfExplorer) • Performance knowledge discovery framework • Data mining analysis applied to parallel performance data • comparative, clustering, correlation, dimension reduction, … • Use the existing TAU infrastructure • TAU performance profiles, PerfDMF • Client-server based system architecture • Technology integration • Java API and toolkit for portability • PerfDMF • R-project/Omegahat, Octave/Matlab statistical analysis • WEKA data mining package • JFreeChart for visualization, vector output (EPS, SVG)
Performance Data Mining (PerfExplorer) K. Huck and A. Malony, “PerfExplorer: A Performance Data Mining Framework For Large-Scale Parallel Computing,” SC 2005, Thursday, 11:30, Room 606-607.
PerfExplorer Analysis Methods • Data summaries, distributions, scatterplots • Clustering • k-means • Hierarchical • Correlation analysis • Dimension reduction • PCA • Random linear projection • Thresholds • Comparative analysis • Data management views
PerfDMF and the TAU Portal • Development of the TAU portal • Common repository for collaborative data sharing • Profile uploading, downloading, user management • Paraprof, PerfExplorer can be launched from the portal using Java Web Start (no TAU installation required) • Portal URL http://tau.nic.uoregon.edu
PerfExplorer: S3D Total Runtime Breakdown WRITE_SAVEFILE MPI_Wait 12,000 cores!
TAU Plug-Ins for Eclipse: Motivation • High performance software development environments • Tools may be complicated to use • Interfaces and mechanisms differ between platforms / OS • Integrated development environments • Consistent development environment • Numerous enhancements to development process • Standard in industrial software development • Integrated performance analysis • Tools limited to single platform or programming language • Rarely compatible with 3rd party analysis tools • Little or no support for parallel projects
Adding TAU to Eclipse • Provide an interface for configuring TAU’s automatic instrumentation within Eclipse’s build system • Manage runtime configuration settings and environment variables for execution of TAU instrumented programs Performance data analysis with tools such as ParaProf aids program performance tuning and refinement of subsequent performance experiments
TAU Eclipse Plug-In Features • Performance data collection • Graphical selection of TAU stub makefiles and compiler options • Automatic instrumentation, compilation and execution of target C, C++ or Fortran projects • Selective instrumentation via source editor and source outline views • Full integration with the Parallel Tools Platform (PTP) parallel launch system for performance data collection from parallel jobs launched within Eclipse • Performance data management • Automatically place profile output in a PerfDMF database or upload to TAU-Portal • Launch ParaProf on profile data collected in Eclipse, with performance counters linked back to the Eclipse source editor
TAU Eclipse Plug-In Features PerfDMF
Future Plug-In Development • Integration of additional TAU components • Automatic selective instrumentation based on previous experimental results • Trace format conversion from within Eclipse • Trace and profile visualization within Eclipse • Scalability testing interface • Additional user interface enhancements
KTAU Project • Trend toward Extremely Large Scales • System-level influences are increasingly dominant performance bottleneck contributors • Application sensitivity at scale to the system (e.g., OS noise) • Complex I/O path and subsystems another example • Isolating system-level factors non-trivial • OS Kernel instrumentation and measurement is important to understanding system-level influences • But can we closely correlate observed application and OS performance? • KTAU / TAU (Part of the ANL/UO ZeptoOS Project) • Integrated methodology and framework to measure whole-system performance
Applying KTAU+TAU • How does real OS-noise affect real applications on target platforms? • Requires a tightly coupled performance measurement & analysis approach provided by KTAU+TAU • Provides an estimate of application slowdown due to Noise (and in particular, different noise-components - IRQ, scheduling, etc) • Can empower both application and the middleware and OS communities. • A. Nataraj, A. Morris, A. Malony, M. Sottile, P. Beckman, “The Ghost in the Machine : Observing the Effects of Kernel Operation on Parallel Application Performance”, SC’07. • Measuring and analyzing complex, multi-component I/O subsystems in systems like BG(L/P) (work in progress).
KTAU System Architecture A. Nataraj, A. Malony, S. Shende, and A. Morris, “Kernel-level Measurement for Integrated Performance Views: the KTAU Project,” Cluster 2006, distinguished paper.
TAU: Interoperability • What we can offer other tools: • Automated source-level instrumentation (tau_instrumentor, PDT) • ParaProf 3D profile browser • PerfDMF database, PerfExplorer cross-experiment analysis tool • Eclipse/PTP plugins for performance evaluation tools • Conversion of trace and profile formats • Kernel-level performance tracking using KTAU • Support for most HPC platforms, compilers, MPI-1,2 wrappers • What help we need from other projects: • Common API for compiler instrumentation • Scalasca/Kojak and VampirTrace compiler wrappers • Intel, Sun, GNU, Hitachi, PGI, … • Support for sampling for hybrid instrumentation/sampling measurement • HPCToolkit, PerfSuite • Portable, robust binary rewriting system that requires no root previleges • DyninstAPI • Scalable communication framework for runtime data analysis • MRNet, Supermon