Download
1 / 21
210 likes | 221 Views
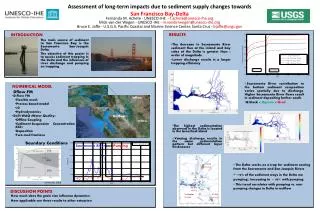
This project assesses the vulnerability of the San Francisco Bay and Delta to sea level rise, including the risk of levee failure and newly inundated areas. The use of a new elevation dataset allows for more accurate assessments of vulnerability. Preliminary results indicate areas at risk of monthly inundation based on sea level rise alone. Additional research will include the effects of storm surges and river inflows on water levels.

E N D
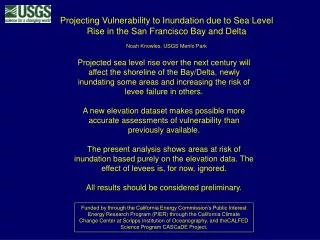
Projecting Vulnerability to Inundation due to Sea Level Rise in the San Francisco Bay and Delta Noah Knowles, USGS Menlo Park Projected sea level rise over the next century will affect the shoreline of the Bay/Delta, newly inundating some areas and increasing the risk of levee failure in others. A new elevation dataset makes possible more accurate assessments of vulnerability than previously available. The present analysis shows areas at risk of inundation based purely on the elevation data. The effect of levees is, for now, ignored. All results should be considered preliminary. Funded by through the California Energy Commission’s Public Interest Energy Research Program (PIER) through the California Climate Change Center at Scripps Institution of Oceanography, and theCALFED Science Program CASCaDE Project.
A new elevation dataset is essentially complete, covering nearly the entire Bay and Delta. • Mainly photogrammetry-based • 10-20 cm vertical accuracy • Horizontal resolution 2-10m • Work by Tom Coons, USGS (funded by CALFED) • Napa R. watershed provided by Bill Dietrich and Ionut Iordache, UCB • missing Petaluma R., Suisun marsh elevation data
Sample Scene: SF business district and Embarcadero > 3 million points in this scene alone
What types of areas are at risk of tidal inundation with sea level rise? First let’s look at just the Bay
At the monthly time scale, about 500 km2 of land are either inundated or protected by levees. This increases by 30% with a 1.0m sea level rise. Next slide shows map at 1.0m sea level rise
The ~150 km2 newly at risk of monthly inundation under a 1.0 m sea level rise are shown in red. below present mean water level below present monthly mean high tide below monthly mean high tide with 1.0m sea level rise Most of these areas are currently protected by levees. They would be inundated only if those levees fail or are overtopped.
An updated land cover dataset has also become available: NLCD2001 http://www.mrlc.gov
Areas of different land cover types at risk of monthly inundation Marsh, grasslands– little change. Developed areas-- big increase.
Areas below mean monthly high tide with 1.0 m sea level rise Main increase in at-risk areas are in the “developed” land cover class.
below present mean water level About 300 km2 newly at risk of monthly inundation under a 1.0 m sea level rise are shown in red. below present monthly mean high tide below monthly mean high tide with 1.0m sea level rise Most of these areas are currently protected by levees. They would be inundated only if those levees fail or are overtopped.
Areas of different land cover types subject to MONTHLY inundation (areas currently below sea level, mainly croplands, are excluded for clarity from this figure only) All categories increase, but big changes are in cropland.
Areas below mean monthly high tide with 1.0 m sea level rise Main increase in at-risk areas are in the “crops” cover class. Not included yet– effects of storm surges, river inflows on water levels. River inflows have a stronger effect than tides in the Delta, and extreme events are most important for levee stability.
More work to do on those “islands” below sea level… Mount and Twiss, SFEWS 2005
Name %vol %prism ------------------------------------------------------------------- Grand Island 10 16 Tyler Island 7 10 Brannan Island 14 18 Staten Island 9 9 Bouldin Island 6 7 Twitchell Island 4 4 Sherman Island 9 13 Webb Tract 6 7 Empire Tract 4 5 Bradford Island 2 3 Venice Island 4 4 King Island 3 4 Mandeville Island 6 7 Jersey Island 2 4 Medford Island 1 2 Rindge Tract 7 9 Bethel Tract 2 4 Quimby Island 1 1 McDonald Tract 7 8 Holland Tract 3 5 Bacon Island 6 7 Palm Tract 2 3 Jones Tract 10 14 Woodward Island 1 2 Orwood Tract 1 3 Victoria Island 5 8 …many other islands not shown Preliminary results: Accurate elevation data permits the calculation of useful information regarding potential levee breaches.
Next Steps • Perform fine calibration of elevation data using ground- truth GPS data where available • Refine estimates of local mean sea level and signal attenuation in channels around Bay and in Delta • Include effects of storm and El Niño surges and river inflows on water levels • Include levee height data and examine extreme events to assess overtopping potential Thanks to Tom Coons for his work on the elevation dataset. Thanks also to the following who provided essential data: Bruce Jaffe, Amy Foxgrover, Theresa Fregosa, Cathy Ruhl, Brad Tom, Chris Enright, Bill Dietrich, Ionut Iordache, Jeff Mount Funded by through the California Energy Commission’s Public Interest Energy Research Program (PIER) through the California Climate Change Center at Scripps Institution of Oceanography, and the CALFED Science Program CASCaDE Project.