Download
1 / 30
300 likes | 440 Views
Connecting Geography and Student Data with GIS. Terrence Willett, Director of Research, Gavilan Community College AIR Conference Boston, MA May 2004. What is GIS?. Geographic Information System Displays geographically based data

E N D
Connecting Geography and Student Data with GIS Terrence Willett, Director of Research, Gavilan Community College AIR Conference Boston, MA May 2004
What is GIS? • Geographic Information System • Displays geographically based data • Essentially a statistics/database program that emphasizes mapped graphs as opposed to bar charts or scatter plots
Human Footprint(Sanderson, Jaiteh, Levy, Redford, Wannebo, & Woolmer; BioScience 2002)
GIS Basics • Data are presented in overlapping feature layers that can take several forms • Point • Cities, schools • Line • Streets, rivers • Polygon • Counties, school districts • Raster • Elevations, thermoclines • The same construct can be represented by different feature types at different scales
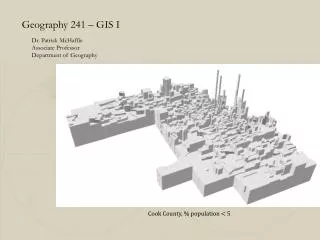
Capabilities of GIS • Plot data by geographic attribute • Country • State • County • Zip code • Census tract • Address • Latitude and longitude from GPS
Census Terminology • Census Tract • 1,500 to 8,000 people with an optimum of 4,000 • Census Block • “areas bounded on all sides by visible features” • Block Group • Group of Census Blocks containing a total of 600 to 3,000 people with an optimum of 1,500
Capabilities of GIS • Code data according to attributes • Size of dots for cities vary by population • Color and style of roads differentiate highways from streets • Color of country varies by rate of deforestation
Capabilities of GIS • Database like • Queries • Appends • Joins and relates • Statistical • Summary statistics • Derived calculations • Distance to nearest high school • Perimeter and area of district • Geocoding • Plot address information on map • Addresses must fit a convention and be accurate • Latitude and longitude information appended to data
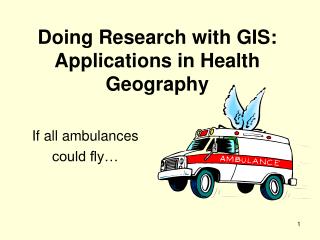
Examples of GIS in IR • Most use centers around facilities planning and enrollment management • Enrollment Distribution • Population Change • Ethnicity and Language Distributions • Understanding Persistence
Increasing Persistence • Persistence helps the student move towards their goal (depending on the goal) and helps increase enrollment • What are the factors that relate to students persisting from one term to the next? • Can we find a model that will accurately predict persistence? • Based on previous work, focus is on students with 12 or fewer attempted units
Gav 2001 pred and actual pers Click Here
DSPS1 in [ “N" ] [ Mode: 1 ] (4,858) HSYEAR < 1999.5 [ Mode: 0 ] (3,346) ENGL in [ "N" "U" ] [ Mode: 1 ] => 1 (1,354, 0.568) ENGL in [ "" "Y" ] [ Mode: 0 ] (1,992) CCUA < 3.5 [ Mode: 0 ] => 0 (978, 0.702) CCUA >= 3.5 [ Mode: 1 ] (1,014) CCUA < 7.5 [ Mode: 0 ] => 0 (473, 0.55) CCUA >= 7.5 [ Mode: 1 ] => 1 (541, 0.564) HSYEAR >= 1999.5 [ Mode: 1 ] (1,512) CCUA < 6.5 [ Mode: 0 ] (840) EDGOALNM in [ "diploma or GED" "unreported" "update job skills" "voc certificate only" ] [ Mode: 0 ] => 0 (69, 0.768) EDGOALNM in [ "AA + transfer" "AA only" "acquire job skills" "basic skills improvement" "formulate interests" "maintain certificate or license" "personal enrichment" "transfer only" "undecided" "voc degree only" ] [ Mode: 1 ] (771) Y < 37.00589 [ Mode: 0 ] => 0 (359, 0.546) Y >= 37.00589 [ Mode: 1 ] => 1 (412, 0.558) CCUA >= 6.5 [ Mode: 1 ] => 1 (672, 0.777) DSPS1 in [ "Y" ] [ Mode: 1 ] => 1 (854, 0.808) Accuracy = 65%
Geocoding Considerations • Takes hours to convert TIGER files to shape files so you probably will only convert a few counties meaning you will not be able to map students far from the district • To convert TIGER files, you need ArcView 3 or a friend or $ • Buying accurate data from private vendors is possible but expensive ($500 - $2000 / county) • Spelling errors cause geocoding errors • Spanish street names cause errors
GIS Software • ArcView and ArcInfo by ESRI • MapInfo (acquired by SPSS) • SAS/GIS • Maptitue by Caliper • http://freegis.org/ • GRASS (Geographic Resources Analysis Support System) open source software for Mac • And others
ArcView 3.x vs. 8-9.x vs. ArcInfo • ArcView is relatively cheap with add on modules (like SPSS and SAS have) and good for most basic users • ArcView 3.x came first and can run Avenue scripts • ArcView 8.x is recent release and represents a major change in how the program operates • ArcView 9.x is current release and can script in Python, VBScript, JScript • ArcInfo is very expensive and used by urban planners and cartographers
GIS File Types • Shape file (.shp) • Has associated .dbf (data table) and .shx (indexing) and possibly .prj (projection), .avl (legend), or others • Interchange format (e00) • TIGER files • Other proprietory file types
TIGER Files • Topologically Integrated Geographic Encoding and Referencing system • Maintained by the Census Bureau • Downloadable free from the web • Is somewhat outdated and inaccurate • Currently undergoing accuracy update
ArcView Versions and TIGER • ArcView 3.x has downloadable scripts written by users over many years and some convert TIGER files to shape files • ArcView 8.x does not run these scripts but there are extensions you can download for free or purchase. None of the free ones convert TIGER files. • Expanded and updated data based on TIGER files are available in a variety of formats for purchase from private vendors.
GIS Resources • California Spatial Information Library • http://www.gis.ca.gov/index.epl • Census Bureau TIGER files • http://www.census.gov/geo/www/tiger/index.html • US Geographic Service • http://www.usgs.gov/ • Geography Network • http://www.geographynetwork.com/ • ESRI • http://www.esri.com
Other GIS Resources • Your colleagues • Your local planning, elections, or water resources departments • Resource agencies (Parks, Forestry) • Fire and Police departments • Public Health (CDC) • Military • United Nations
Final Thoughts • You already have GIS applicable skills through your work with database and statistical programs • GIS skills are transferable to a great number of situations • GIS software is cheap and much data is free • Take a class • It does take time and passion (do you have a map on the wall of your office?)
Thank YouTerrence Willett, Director of Research, Gavilan Collegetwillett@gavilan.edu 408.848.4852www.gavilan.edu/research