Download
1 / 33
330 likes | 677 Views
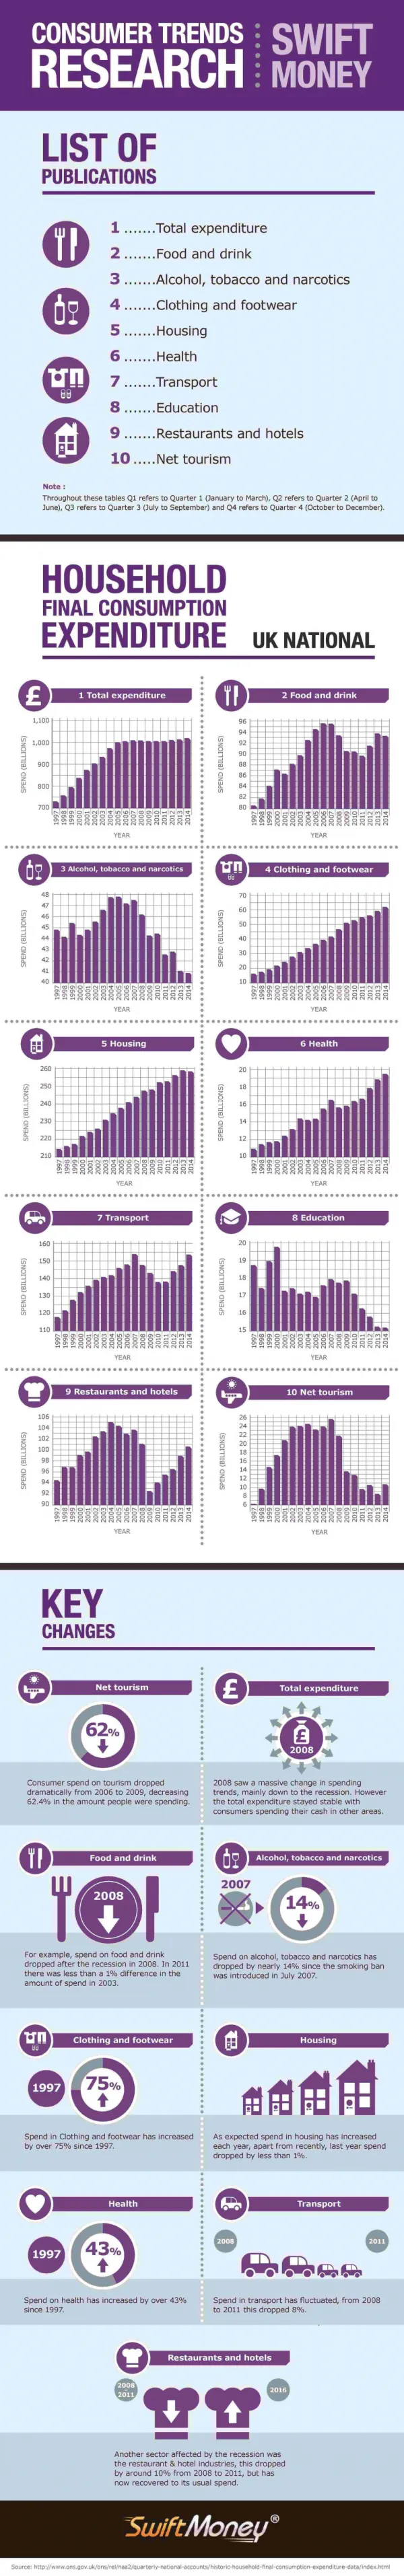
Consumer Purchase Trends. Panel 101. Meghan Obergefell Client Insights Consultant. What is a panel? What is panel data?. A Panel is a group of households who agree to regularly report their product purchasing over time .

E N D
Consumer Purchase Trends Panel 101 Meghan Obergefell Client Insights Consultant
What is a panel? What is panel data? A Panel is a group of households who agree to regularly report their product purchasing over time "Panel Data" is the information gathered from such households when they make purchases. It provides insights into the consumer purchase dynamics behind product sales. ?
How do you know it’s a panel issue? When you run across these key words: SwitchingHeavy BuyerLight BuyerTripsFrequencyPurchase CycleLoyaltyConversionCore/Occasional shoppers BuyerConsumerShopperSpendingPurchasingHow oftenHow muchDemographicsTrial or repeat
1 2 Demographic Data Purchase Information IRI Panel data collectionIntegrates 3 types of information from 100,000 Households 3 Causal Data Consumer Panel Data
1 Demographic Data IRI Panel Data Collection Demographics • Demographics collected include:IncomeHH sizepresence/age of childrenage/education/occupation/work status of male and female heads of householdraceplus others Recorded when a household joins, updated annually
2 Purchase Information IRI Panel Data Collection • Low Panelist Burden • Panelist selects outlet type & store address • Scans UPCs • Enters receipt total • Places ScanKey in unit for automatic upload • A subset of IRI Panelists input price and promotion data for a select group of outlets: Wal*Mart, Dollar, Club, and Pet Specialty. IRI panelist: 4.3 trips per week totaling 15 minutes. Reporting causal adds less than 4 minutes per week.
National Consumer Panel Price and Causal Data • Multi-option reporting system which incorporates scanner, audit, and panelist input information • Price and Price Reductions directly from sample/census store data tapes for Food, Drug, K-Mart, and Target. • Features and Displays from weekly store audits by IRI staff for Food, Drug, K-Mart, and Target. • Non-FDM & Wal*Mart price & causal data sourced from panelist input and audit by IRI staff. 3 Causal Data
National Consumer Panel • Total US – 100,000 active panelists • Static Sample of 65,000 regularly scanning HH’s • 4 Census Regions • 8 IRI Regions • 64 Local Markets
Store and Panel Data – optimal uses for both Panel Scanner/Store Data • What is happening in the store:Sales TrackingDistributionPrice PromotionsBase vs Incremental • What is driving Store Sales:How many HH's buyPurchase FrequencyPurchase SizeHousehold SpendingBuyer DemographicsLoyalty CouponsRepeat PurchasingConsumer attitudes
Components of Sales • Sales are a function of Household Penetration and Buying Rate fewer are buying Sales are X X because: down and/or buyers buying less X
% Households Buying - Penetration • Percent of all households that bought the product at least once over the analysis period Penetration = 40% 4 of 10 of all households purchased Pillsbury Brownies
Marketing Elements that influence Penetration • Availability • Price • Couponing • Trial Packs • Displays • In Store Sampling • Media • Advertising Theme • Cross Promotions Penetration (% of HH’s Buying)
Sales per Buyer - Buying Rate • Average amount (volume, dollars, units) of product purchased by each household that purchased the product over the analysis period. HH #1 2 Units HH #2 6 Units Average Unit Sales per Buyer = 4 Units
Purchase Occasions Per Buyer (Purchase Frequency) • Average number of shopping trips in which the product was purchased HH #1 2 occasions HH #2 4 occasions Average Purchase Occasions per Buyer = 3 occasions Purchase Occasions per Buyer X Sales per Purchase Occasion =Buying Rate
Elements that influence Purchase Frequency • Pack Size • More Product Uses • Product Quality • Cents Off Label • Featuring • Greater Variety • Displays • Coupons • Advertising Purchase Frequency
Sales Per Purchase Occasion (Transaction Size) • Average sales (EU, Units or dollars) purchased per trip in which the product was purchased. HH #1 2 Units per Trip HH #2 1 Unit per Trip Units per Purchase Occasion = 1.5 Units Purchase Occasions per Buyer X Sales per Purchase Occasion = Buying Rate
Marketing Elements that influence purchase size • Pack Size • More Product Uses • 2 for Pricing • Bonus Packs • Aisle Displays • Features • Coupons Transaction Size
How can you use Purchase Dynamics to develop Strategies? high buying rate Increase Users Maintain/Protect - monitor and track- create alerts- understand how competition reacting- continually innovate- improve profitability - advertise/feature/display to increase awareness - promo support to encourage trial coupons sampling trial sizes low penetration high penetration Increase Usage Niche Marketing Opportunities - display large sizes - advertising aimed at new product usage occasions - bonus/special packs/”2 for” deals - repeat oriented promotions including on-pack coupons - focus on marketing to target buyers - capitalize on opportunities to bring new buyers to the franchise - focus on sourcing purchase occasions from other niche brands low buying rate
% Buyers Repeating (Repeat Rate) Among buyers of an item, the % of buyers who make at least 1 repeat purchase during the analysis period Smuckers Repeat Rate = 40% Repeat Rate helps to understand the proportion 1 time buyers vs repeat buyers in your franchise. A buyer need only repeat 1 time (2 total purchases) to be counted. Multiple repeats are not shown with this measure.
Purchase Cycle The average number of days between purchase pairs among 2+ time buyers of the product Purchased on: Day 10 Day 20 Day 60 Day 5 Day 40 Purchase Cycle Pair 1 (20-10) = 10 Pair 2 (60-20) = 40 HH #1 Avg is 25 Pair 1 (40-5) = 35 HH #2 Avg is 35 The average among both HH’s is 30 (25+35)/2 = 30
Share of Requirements (Loyalty) Among buyers of an item, the % of their total category/type volume allocated to that brand …or the brand’s share among its buyers. Smuckers Share of Requirements = 50% Loyalty helps us understand what percentage of a brand buyer’s total category needs are being satisfied by a particular brand. In the example above Smuckers Fruit Spreads buyers satisfy half (50%) of their category requirements with Smuckers, 25% with Welch’s and 25% with Cascadian Farms.
Elements that can influence Loyalty • Number of competitive brands in category • Example: There tends to be low loyalty among softdrink brands -- lots of variety seeking. • Category Purchase Cycle • Example: Drain Cleaners has a very long purchase cycle - buyers tend to make only 1 purchase in a year. 1-time buyers are by definition 100% loyal. Look at longer time frame – if your product has a long purchase cycle. • A Decline in Penetration • Example: When a brand’s sales are down, a brand’s loyalty among its remaining franchise may actually rise as less loyal buyers drop out.
Deal Measures • % Volume any Deal • The percentage of volume sold on any feature, display, price reduction of at least 5% or manufacturer coupon. Because of couponing, this measure may be higher than a store data measure • % Volume by Merchandising Condition • Manufacturer Coupon • Feature • Display • Price Reduction
In Basket and Out of Basket In Basket - The average dollar amount spent on total basket when an item is included in the market basket When consumers purchase Hungry Jack their market basket is worth $102 Out of Basket - The average dollar amount spent on total basket when an item is not included in the market basket When consumers do not purchase Hungry Jack their market basket is worth $47 Market Basket is a retailer measure used to determine if buyers of a particular brand are more valuable when they are purchasing the brand than when they are not purchasing the brand.
Open Access Panel: Agenda • What’s Included in Open Access • What’s not Included in Open Access • Ad Hoc Workflow Process
Open Access: What’s Included? What’s included • Dedication of time and resources for a full time employee (Meghan Obergefell) • Base Panel Reports and Analysis from JMS custom databases. • Includes any panel reports that can be run by IRI’s panel data engine, Krystal. • Examples of Krystal reports include • Purchase trends/ summaries • Standard demographics • Trial and repeats • Brand switching • Cross purchase • Standard target group analyses (demographic and retailer specific) • Standard NLR buyer flows • Leakage Trees
Open Access: What’s Not Included? • Panel data deliverables NOT included in the Panel Open Access Agreement are any reports and services outside of the Krystal on-line panel tool. • Excluded products include • Analysis of Non-JMS Categories • Consumer Insights for Wal-Mart Service • Custom Panel analyses, Custom Panel target group creation • Attitude Link Surveys, Survey target groups • Syndicated and Custom Builders • Disaggregated Data feeds • RX Pulse, MedProfiler • Panel on Demand, CPGN or Plus Suite application • Any 3rd party partnerships
Ad Hoc Workflow Process • Identify business issue to be addressed – fill out a Project Request Form to initiate all ad hoc projects. • This will help the JMS and IRI manage requests from various teams and assign priority appropriately. • Submit form via e-mail to Meghan Obergefell, Andy Leibold and Joe Trapp. • Upon receiving the request, the project will be added to the ad hoc project list and a delivery date will be assigned based on project priority and existing project queue.
Additional Analyses • Retailer Distribution Tool – Consumer Segmentation • Demographic Tools – Annual Panel and Retailers • Retailer Purchase Trends – Delivered every other month • J:\Sales_Category Development\Category Development Perm20\Category Management Tools\Open Access Deliverables • Leakage Tree - As needed • Times and Trends – IRI Corporate Analyses • http://www.iriworldwide.com/Insights/Publications/TimesTrends.aspx