Download
1 / 71
710 likes | 900 Views
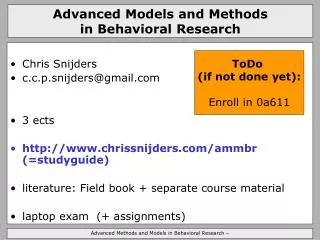
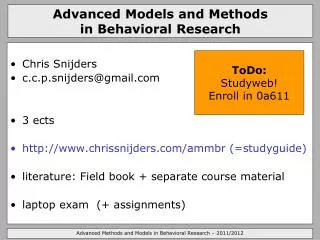
Advanced Models and Methods in Behavioral Research. Chris Snijders c.c.p.snijders@gmail.com 3 ects http://www.chrissnijders.com/ammbr (=studyguide) literature: Field book + separate course material laptop exam (+ assignments). ToDo: Studyweb! Enroll in 0a611. The methods package.

E N D
Advanced Models and Methods in Behavioral Research • Chris Snijders • c.c.p.snijders@gmail.com • 3 ects • http://www.chrissnijders.com/ammbr (=studyguide) • literature: Field book + separate course material • laptop exam (+ assignments) ToDo: Studyweb! Enroll in 0a611 Advanced Methods and Models in Behavioral Research – 2011/2012
The methods package • MMBR (6 ects) • Blumberg: algemeen: vraagstelling, betrouwbaarheid, validiteit etc • Field: SPSS: factor analyse, multiple regressie, ANcOVA, sample size etc • AMMBR (3 ects) - Field (deels): logistische regressie - literatuur via website: conjoint analysis multi-level regression Advanced Methods and Models in Behavioral Research – 2011/2012
Models and methods: topics • t-test, Cronbach's alpha, etc • multiple regression, analysis of (co)variance and factor analysis • logistic regression • conjoint analysis / repeated measures • Stata next to SPSS • “Finding new questions” • Practice data collection (a bit) In the background: “now you should be able to do it on your own” Advanced Methods and Models in Behavioral Research – 2011/2012
Methods in brief (1) • Logistic regression: target Y, predictors Xi. Y is a binary variable (0/1). - Why not just multiple regression? - Interpretation is more difficult - goodness of fit is non-standard - ... Advanced Methods and Models in Behavioral Research – 2011/2012
Methods in brief (2) • Conjoint analysis Underlying assumption: for each user, the "utility" of a product can be written as U(x1,x2, ... , xn) = c0 + c1 x1 + ... + cn xn • 10 Euro p/m • 2 years fixed • free phone • ... • How attractive is this • offer to you? Advanced Methods and Models in Behavioral Research – 2011/2012
Conjoint analysis as an “in between method” Between Which phone do you like and why? What would your favorite phone be? And: Let’s keep track of what people buy. Advanced Methods and Models in Behavioral Research – 2011/2012
Coming up with new ideas (3) “More research is necessary” But on what? YOU: come up with sensible new ideas, given previous research Advanced Methods and Models in Behavioral Research – 2011/2012
Stata next to SPSS • It’s just better (faster, better written, more possibilities, better programmable …) • Multi-level regression is much easier than in SPSS • It’s good to be exposed to more than just a single statistics package (your knowledge should not be based on “where to click” arguments) • More stable (I think) • Supports OSX as well… (anybody?) Advanced Methods and Models in Behavioral Research – 2011/2012
But … • Output less “polished” • It takes some extra work to get you started • The Logistic Regression chapter in the Field book uses SPSS (but still readable for the larger part) • (and it’s not campus software, but subfaculty software) • Installation … Advanced Methods and Models in Behavioral Research – 2011/2012
Advanced Methods and Models in Behavioral Research • Make sure to • enroll in studyweb (0a611) • Read the Field chapter on logistic regression Advanced Methods and Models in Behavioral Research – 2008/2009 10 Advanced Methods and Models in Behavioral Research – 2011/2012
Logistic Regression Analysis That is: your Y variable is 0/1: now what? Credit where credit is due: slides adapted from Gerrit Rooks
The main points • Why do we have to know and sometimes use logistic regression? • What is the underlying model? What is maximum likelihood estimation? • Logistics of logistic regression analysis • Estimate coefficients • Assess model fit • Interpret coefficients • Check residuals • An SPSS example
Advanced Methods and Models in Behavioral Research – 2011/2012
Suppose we have 100 observations with information about an individuals age and wether or not this indivual had some kind of a heart disease (CHD)
Let’s just try regression analysis pr(CHD|age) = -.54 +.0218107*Age
... linear regression is not a suitable model for probabilities pr(CHD|age) = -.54 +.0218107*Age
In this graph for 8 age groups, I plotted the probability of having a heart disease (proportion)
Predicted probabilities are always between 0 and 1 similar to classic regression analysis
Side note: this is similar to MMBR … Suppose Y is a percentage (so between 0 and 1). Then consider …which will ensure that the estimated Y will vary between 0 and 1 and after some rearranging this is the same as Advanced Methods and Models in Behavioral Research – 2011/2012
… (continued) • And one “solution” might be: • Change all Y values that are 0 to 0.001 • Change all Y values that are 1 to 0.999 • Now run regression on log(Y/(1-Y)) … • … but that doesn’t work so well … Advanced Methods and Models in Behavioral Research – 2011/2012
Logistics of logistic regression • How do we estimate the coefficients? • How do we assess model fit? • How do we interpret coefficients? • How do we check regression assumptions?
Kinds of estimation in regression • Ordinary Least Squares (we fit a line through a cloud of dots) • Maximum likelihood (we find the parameters that are the most likely, given our data) We never bothered to consider maximum likelihood in standard multiple regression, because you can show that they lead to exactly the same estimator. OLS does not work well in logistic regression, but maximum likelihood estimation does … Advanced Methods and Models in Behavioral Research – 2011/2012
Maximum likelihood estimation • Method of maximum likelihood yields values for the unknown parameters which maximize the probability of obtaining the observed set of data. Unknown parameters
Maximum likelihood estimation • First we have to construct the likelihood function (probability of obtaining the observed set of data). Likelihood = pr(obs1)*pr(obs2)*pr(obs3)…*pr(obsn) Assuming that observations are independent
Log-likelihood • For technical reasons the likelihood is transformed in the log-likelihood (then you just maximize the sum of the logged probabilities) LL= ln[pr(obs1)]+ln[pr(obs2)]+ln[pr(obs3)]…+ln[pr(obsn)]
Note: optimizing log-likelihoods is difficult • It’s iterative (“searching the landscape”) • it might not converge • it might converge to the wrong answer Advanced Methods and Models in Behavioral Research – 2011/2012
This function fits very well, other values of b0 and b1 give worse results
Logistics of logistic regression • Estimate the coefficients • Assess model fit • Between model comparisons • Pseudo R2 (similar to multiple regression) • Predictive accuracy • Interpret coefficients • Check regression assumptions
Model fit: comparisons between models The log-likelihood ratio test statistic can be used to test the fit of a model full model reduced model The test statistic has a chi-square distribution
Between model comparisons: likelihood ratio test full model reduced model The model including only an intercept Is often called the empty model. SPSS uses this model as a default.
Between model comparison: SPSS output This is the test statistic, and it’s associated significance
Just like in multiple regression, pseudo R2 ranges 0.0 to 1.0 Cox and Snell cannot theoretically reach 1 Nagelkerke adjusted so that it can reach 1 Overall model fitpseudo R2 log-likelihood of the model that you want to test log-likelihood of model before any predictors were entered NOTE: R2 in logistic regression tends to be (even) smaller than in multiple regression
Overall model fit: Classification table We correctly predict 74% of our observations
Overall model fit: Classification table 14 cases had a CHD while according to our model this shouldnt have happened
Overall model fit: Classification table 12 cases didn’t have a CHD while according to our model this should have happened
Logistics of logistic regression • Estimate the coefficients • Assess model fit • Interpret coefficients • Direction • Significance • Magnitude • Check regression assumptions
Interpreting coefficients: direction We canrewriteour model as follows:
Interpreting coefficients: direction original b reflects changes in logit: b>0 implies positive relationship exponentiated b reflects the changes in odds: exp(b) > 1 implies a positive relationship 46
3. Interpreting coefficients: magnitude The slope coefficient (b) is interpreted as the rate of change in the "log odds" as X changes … not very useful. exp(b) is the effect of the independent variable on the odds, more useful for calculating the size of an effect 47
For the age variable: Percentage change in odds = (exponentiated coefficient – 1) * 100 = 12%, or “the odds times 1,117” A one unit increase in age will result in 12% increase in the odds that the person will have a CHD So if a soccer player is one year older, the odds that (s)he will have CHD is 12% higher Magnitude of association
Another way to get an idea of the size of effects: Calculating predicted probabilities For somebody of 20 years old, the predicted probability is .04 For somebody of 70 years old, the predicted probability is .91