Download
1 / 6
60 likes | 143 Views
Press the right-arrow button to advance through this presentation. Student scores are confidential. Therefore the example below is merely a simulation model. None of the score data displayed below is real. FAQ. TVAAS.

E N D
Press the right-arrow button to advance through this presentation Student scores are confidential. Therefore the example below is merely a simulation model. None of the score data displayed below is real. FAQ TVAAS How Do I Interpret and Use the Projected Scores Spreadsheet from the TVAAS Website? Slide 1 Source: TVAAS website as of July 2013 Website String: TVAAS website, Export, Data, Student Projections, Exported Files • Percentile Projections • Based on past testing history in your subject area and all other tested subjects areas over the last 3 to 5 years • Is computed by SAS as a projection of what this student is likely to score if he or she receives an average education from an average teacher for this subject at an average school in Tennessee Source reference: (provided on slide 5)
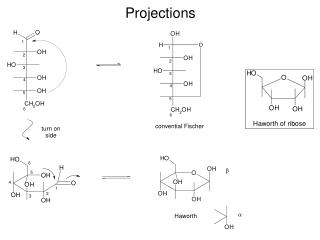
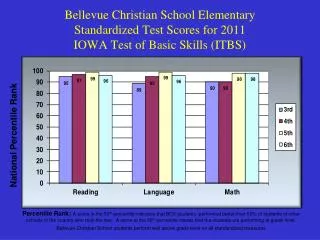
FAQ TVAAS How Do I Interpret and Use the Projected Scores Spreadsheet from the TVAAS Website? Slide 2 • More About TVAAS Percentile Projections • Percentile scores are not percentages! • Percentiles are determined by graphing all the score data in a normal curve distribution (a bell curve). • Example: A student that scored in the 80th percentile scored equal or higher than 80% of all the students that took that same test. (They are not the same thing) (see image below)
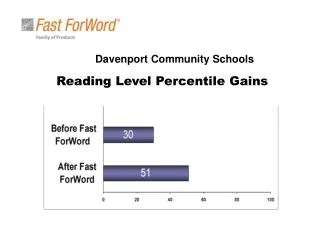
FAQ TVAAS How Do I Interpret and Use the Projected Scores Spreadsheet from the TVAAS Website? Slide 3 • How to Use These Percentile Projections • I recommend that you convert them into percentage scores • which are commonly used by many teachers for scoring quizzes and tests • Perhaps the easiest and most accurate way to do this is to simply use your student's TCAP Quick Scores from last year along with their actual TCAP scores from last year • Quick Scores have already been converted into percentage format for us • Make a chart showing each student's Quick Score. Then match that student's name with what he or she actually scored on the TCAP test. • Then delete all the names and student ID numbers, fill in the gaps, and you will have a valid conversion table for percentages to percentiles to use for this year's students • Once you have your conversion table, make a list with this year's student's names
FAQ TVAAS How Do I Interpret and Use the Projected Scores Spreadsheet from the TVAAS Website? Slide 4 • How to Use These Percentile Projections (Continued) • Use the current projected scores report from TVAAS to obtain the percentile projections for your current students • Use your conversion table created from last year's data to convert these percentiles into percentages • Use the percentage projections as target goals with your current students • For any and every appropriately aligned quiz or test, you can challenge your current students to earn a score equal or greater than the projected score • You may even find it helpful to inflate the projection by a few percentage points to make sure you are adequately challenging your students • If you can enable your students to consistently earn a score equal or higher than their projected score then it is very probable that they will show growth with the TCAP test
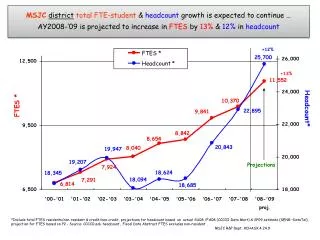
Student scores are confidential. Therefore the example below is merely a simulation model. None of the score data displayed below is real. FAQ How Do I Interpret and Use the Achievement Probabilities Data TVAAS Slide 5 You can view TVAAS Student Projections Two Ways: (1) View Individual Student Reports (as shown below), or view all students in a single spreadsheet format (I have instruction for the spreadsheet format in a separate PP presentation. Source: TVAAS website as of August 2013 Website String: (for Individual Student Reports) 1) Log in to theTVAAS website, 2) Select the Reports tab 3) Future Academic Performance, 4) School (Single Grade) Future Academic Performance, 5) select the grade level, 6) select the test and subject, 7) select either advance, accelerate II, or accelerate I, 8) select a student's name, 9) select the subject, 10) select student reports, 11) select student projection reports Report: Student Projection Report Student: John Doe 02 Projection: 8th TCAP Science 99 Expressed in State %-tiles 90 Projection: 8th TCAP Science 80 Projected State Percentile Probability of Success 70 Basic Proficient Advanced 60 81 99.9% 99.2% 55.1% 50 40 30 20 10 01 TCAP (Sci) 2011 (6) TCAP 2009 (4) TCAP 2010 (5) TCAP 2012 (7) TCAP 2008 (3) TCAP
FAQ TVAAS How Do I Interpret and Use the Projected Scores Spreadsheet from the TVAAS Website? Slide 6 • Reference Sources about TVAAS Score Projections/Predictions • For more details about EVAAS/TVAAS projection methodology, read the following two documents • (1) "What Should Teachers Know About TVAAS Student Probabilities?" • -(2011 SAS Policy Brief byCathy Brinsfield ) • -access it via the TVAAS log on webpage under "Training and Development" • Link: TVAAS Log On Webpage • (2) "Measurement of Academic Growth of Individual Students toward Variable and Meaningful Academic Standards " • -(2006 SAS White Paper by Wright, Sanders, and Rivers ) • Link: SAS White Paper about score projections