Download
1 / 18
180 likes | 288 Views
Discover the power of interactive spreadsheets in teaching mathematical concepts through engaging, dynamic storytelling. Developed by Scott A. Sinex at Prince George's Community College, these resources provide easy access for students and simple development for instructors. Excelets allow students to predict, test, and analyze, enriching their understanding of scientific processes while camouflaging complex math. With numerous activities and tools for data modeling, this innovative approach fosters deeper comprehension and sparks curiosity in science and mathematics.

E N D
Animated Interactive Spreadsheets: It’s Dynamic Graphical Storytelling Time! Scott A. Sinex Dept. of Physical Sciences & Engineering Prince George’s Community College
Why interactive spreadsheets? Easy access for students and useful for them to know Easy for instructors to develop – see Developer’s Guide to Excelets Creates an engaging pedagogy
…more why? Addresses topics conceptually, while camouflaging mathematics Students have to think: predict - test - analyze Allows for mathematical modeling and studying errors More science process Mathematics resurfaces!!!!
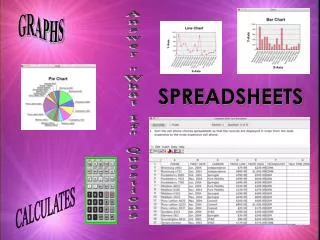
…and every graph tells a story! Why is pizza cut in even number of slices?
Here we use spinner from the Forms toolbar. The Forms Tools operate on both PC and Mac platforms. http://academic.pgcc.edu/~ssinex/excelets/fractions.xls
How does a burning candle behave? Here we collect the data by clicking the up arrow on the spinner. http://academic.pgcc.edu/~ssinex/excelets/burning_candles.xls
…adding error to the data Scatter is added to the data by increasing random error. =E6+$K$7*RANDBETWEEN(-10,10)/10+$G$10 The circled scroll bar controls the size of random variation.
Burning candle… • The activity including notes to the instructors– http://academic.pgcc.edu/~ssinex/excelets/burning_candles_act.pdf • The Excelet – http://academic.pgcc.edu/~ssinex/excelets/burning_candles.xls
Viewing data of tidal gauge stations Option buttons allow which data set is viewed. http://academic.pgcc.edu/~ssinex/excelets/inundator.xls
Just add data… When data is added, mathematical model appears. http://academic.pgcc.edu/~ssinex/excelets/stacking_cups.xls
…physical and mathematical models The rim height controls the slope and the base height controls the y-intercept. Look under the graphs for how they were constructed!!!
…and more Excelets • Learn linear regression http://academic.pgcc.edu/~ssinex/regression.xls • Interpolation and extrapolation http://academic.pgcc.edu/~ssinex/interpol_extrapol.xls • x- and y-intercpets http://academic.pgcc.edu/~ssinex/excelets/intercepts.xls • Rate of change explorer http://academic.pgcc.edu/~ssinex/excelets/Rate_of_Change_Explorer.xls
Remember… • It is all done computationally – formulas, logical statements (no programming!!!) • Look under the graphs for construction help. • See the Developer’s Guide for instructions!!!!
Student feedback… Which do you prefer: Spring 07Spring 09 static graphs in textbook 21% (6) 7% (2) dynamic graphs in Excel76% (22) 89% (25) both 3% (1) 4% (1) Using Excelets does not require that you be familiar with Excel. most definitely 7% (2) 25% (7) I think so 38% (11) 36% (10) just barely 34% (10) 32% (9) not at all 14% (4) 7% (2) don’t know 7% (2) All Student Survey results http://academic.pgcc.edu/~ssinex/excelets/assess.htm
more feedback… Excelets offer a more visual experience with graphs instead of using just the mathematical equations. most definitely 66% (19) 75% (21) I think so 24% (7) 14% (4) just barely 10% (3) 11% (3) not at all don’t know Excelets make it easier to grasp or learn a concept. most definitely 55% (16) 43% (12) I think so 31% (9) 54% (15) just barely 14% (4) 4% (1) not at all don’t know
The “How to” resources... Developer's Guide to Excelets: Dynamic and Interactive Visualization with "Javaless" Applets or Interactive Excel Spreadsheets <http://academic.pgcc.edu/~ssinex/excelets> Tutorial, instructions, and over 150 interactive Excel spreadsheet examples Resource list for mathematics and science
More info... Scott Sinex ssinex@pgcc.edu http://academic.pgcc.edu/~ssinex Partial support for this work was provided by the Howard/Hopkins/PGCC Partnership for Research and Education in Materials (PREM), funded by NSF Grant No. DMR-0611595 …and thanks for coming today too!!!