Download
1 / 11
110 likes | 158 Views
Understand the importance of generalization in statistical thematic mapping, including map scales, goals, operations, and algorithms for optimal visualization and accuracy.

E N D
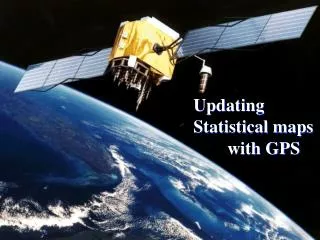
Generalisation for statistical thematic maps Mrs Diana Makarenko-Piirsalu MSc in Landscape Ecology and Environmental Protection Geolytics OÜ Mere tee 15, Saviranna, Jõelähtmevald, Harjumaa, ESTONIA diana.makarenko-piirsalu@geolytics.ee Mob. +372 556 19 636 ESTP Course: Use of GIS in NSIs – Representing statistics on thematic maps, Kongsvinger,Norway, 5th to 7th of March, 2013 Attribution (by) Licensees may copy, distribute, display and perform the work and make derivative works based on it only if they give the author or licensor the credits in the manner specified by these. http://creativecommons.org/licenses/by/3.0/
Generalisation level and map scales • Map scale is defined as the ratio of distance on the map to the actual distances on the Earth ground. • Generalisation is a selection and simplified representation of detail appropriate to the scale and/or the purpose of a map. Small scale maps Large scale maps Medium scale maps 1:5 000 1:25 000 1:200 000 1:500 000 1:1 000 000 1:50 000 1:100 000 1: 60 000 000 Smaller area Part of the town Bigger area Europe, World More details Single house Less details Country names Less generalized More generalized
What is a goal of generalization? • Reduce complexity • Maintain spatial accuracy • Maintain attribute accuracy • Maintain aesthetic quality • Maintain a logical hierarchy • Due to a scale change generalization goal is to avoid • that too many object will be compressed into too small area • that features will collide • noise on the map and provide readable maps Source: Slocum et al,Thematic Cartography and Geovisualization 2009
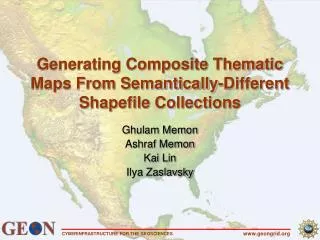
Generalisation of thematic maps • Generalisation of attribute data (for example data aggregation into mapped unit level) • Generalisation of mapped units (country borders, NUTS, LAU etc.) • Generalisation of symbols • Depends on the output map format and scale
Example of generalized regions 1: 3 000 000 1: 10 000 000 1: 60 000 000 1: 20 000 000
Dilemma • Improving display quality vs geometrical or statistical calculations accuracy. • Area calculation , length and distance etc calculations error will have higher error on small scale maps. • In general it is advisable to generalize at the source map scale and then to reduce to the desired scale. • Data which are already generalized by others is difficult to generalize as the assumptions made and methods used are not necessarily known.
Generalisation operations • Simplification – reducing the number of coordinates required to replace an object • Smoothing – Reducing angularity of angels between the lines • Aggregation – Grouping point locations and representing them as areal objects • Amalgation – grouping several areal features into a larger element • Collapse – replacing a feature with symbol • Merging – grouping of line features • Refinement – Selecting specific portions of an pbject to represent the entire objects • Exaggregation – to amplify specific portion of an object • Enhancement – to elevate the message impaired by the object • Displacement – separating objects
The most used simplifications algorithm • Douglas – Peucker • process lines holistically • considers the entire line • selects critical points iteratively • Users can specify tolerance value, which determines how much details the algorithm eliminates
THANK YOU! Mrs Diana Makarenko-Piirsalu MSc in Landscape Ecology and Environmental Protection Geolytics OÜ Mere tee 15, Saviranna, Jõelähtmevald, Harjumaa, ESTONIA diana.makarenko-piirsalu@geolytics.ee Mob. +372 556 19 636 ESTP Course: Use of GIS in NSIs – Representing statistics on thematic maps, Kongsvinger,Norway, 5th to 7th of March, 2013