Download
1 / 24
250 likes | 409 Views
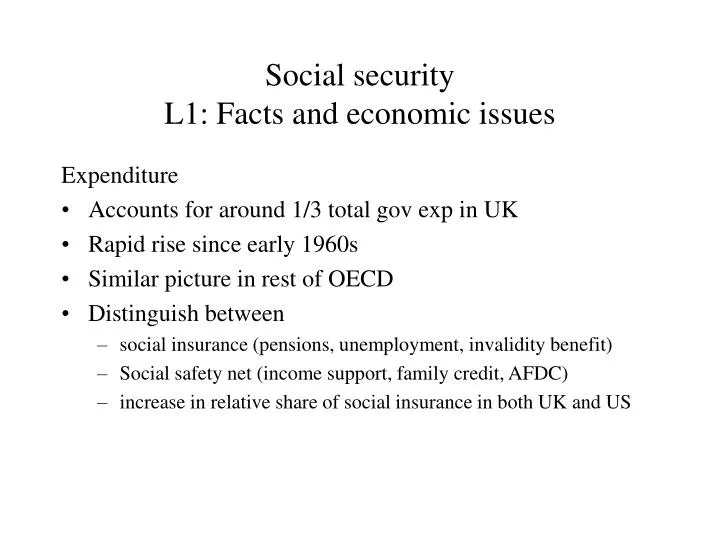
Social security L1: Facts and economic issues. Expenditure Accounts for around 1/3 total gov exp in UK Rapid rise since early 1960s Similar picture in rest of OECD Distinguish between social insurance (pensions, unemployment, invalidity benefit)

E N D
Social security L1: Facts and economic issues Expenditure • Accounts for around 1/3 total gov exp in UK • Rapid rise since early 1960s • Similar picture in rest of OECD • Distinguish between • social insurance (pensions, unemployment, invalidity benefit) • Social safety net (income support, family credit, AFDC) • increase in relative share of social insurance in both UK and US
Rational for government intervention 1. High transactions costs of private insurance 2. Social risks and lack of indexation e.g. inflation 3. Adverse selection 4. Moral hazard 5. Equity concerns
Private Insurance and admin costs p: probability worker is ill, cannot work (1-p): works, earns w k: income from captial Sickness insurance If well: w(1-e) + k If sick: b + k If insurance is ‘fair’ (1-p)w = p.b If individual is risk averse, choose f Admin costs: Cost per policy = a Benefit paid = a/p Work Indifference curve w+k Full insurance No insurance Slope = -p/(1-p) With admin costs 45° Sickness k
Impact of adverse selection on private insurance P+ : high risk P- : low risk Indifference curve for low-risk group AD: Locus of contracts which break even if all population buys (‘pooling’ equilibrium) AC+: Break even if high-risk buy AC-: Break even if only low-risk buy At B: a rival company can attract low-risks ‘pooling equilibrium not stable Separating equilibrium: Offer high-risk along AC+ Offer low-risk along AC- Low-risk prefer pooling May not exist if few p+ Note: separating equilib. is problem for low risk, social concern is for high risk Work E A B C- 45° line D C+ Indifference curves for high-risk group Sickness
Economic impact of social security: moral hazard Work incentives, family formation, savings incentives • Replacement rates - incomes in and out of work (Figs 13 and 14) • Poverty trap - high marginal tax rates on benefits • Esp true for housing benefit, families with one earner. 1996-7 700,000 individuals had marginal tax rates of over 50% • Partners of the unemployed • high labour SS elasticity of married women • polarisation of couples (Fig 18)
Economic impact of social security: moral hazard • Becoming a lone parent • Little evidence for the UK, mixed evidence for the US • Lone parenthood and work incentives • Poverty trap tends to be stronger for this group (tend to be lower paid than men) Fig 19 • 1989-91 43% lone parents employed, 62% married women with children • Positive impact of social security on labour market • Labour shedding from risky/declining industries • Maternity benefits encourage female labour force participation (return but change jobs)
Economic impact of social security: moral hazard • Savings for retirement • Pay-as-you-go versus accumulated pensions funds impact of K formation and productivity • Slide for details • evidence mixed - unresolved (Barr)
Impact of pensions from State on savings 2 period model, C1 and C2, p=price of C2=1/(1+r), M = w(1-t) + g (i) Taxation of wages: pure wealth effect. (ii) Taxation of income (including interest income). Will increase price of second period consumption p = 1/(1+r(1 - t) i.e. an increase in price of C2 If taxes are (i) + (ii) impact depends on: • wealth elasticity of C1 • price of C2 • elasticity of substitution of C1 for C2
Impact of pensions from State on savings cont Wealth effect: Consumption in period 2 increased by g C2 p1 100% implicit tax rate p A g C1 • If C1 is a normal good savings decline • 100% implicit tax rate corner solution at A where s = 0
1+r (1-t) 1+r (1-t) p p Impact of pensions from State on savings cont r = interest rate p = 1 C1+ C2 = M = w(1+r)(1-t) C1 C1 C2 C1 - = M U p (= r = t): C1 from substitution effect C1 through wealth effect ( individual is a lender)
Impact of pensions from State on savings cont C2 w(1+r) (a) low elasticity of substitution P Q P' w C1 C2 w(1+r) (b) high elasticity of substitution P Q P' w C1
Economic impact of social security: moral hazard • Early retirement • economic effect: individuals are richer because expect to have pension (income effect), have tax on earnings (substitution effect) • evidence: decrease labour force part. in OECD. Problem in particular groups of men with incorrect skills • General observations • Actual impact of social security depends on institutional design • Moral hazard is a problem of private insurance systems as well (e.g. early retirement)
Social Security: L2: Reforms Failure of current UK system 1. 20 percent of population are poor, 1 in 3 children in poverty 2. Original system (Beveridge): • 10% of population over 65+ • children lived in two adult households • gov committed to high employment policies • poverty could be dealt with by NI (causes = old age, unemployment) with a small safety net (National assistance)
Social Security: L2: Reforms cont 3. Demographic and social change • aging population: 18.5% pop over stat retirement age • changing family structures • 1989 4 percent of adult cohabiting • 1970-91 % birth outside marriage increased from 8-30% • 1951-1987 divorce rate increased from 3 to 13 per 1000 couples 4. Labour market • higher unemplyment, increase l-term U • increased lab. Market participation of women esp part-time • increase self emp 5. Causes of poverty • Poorest 1/5 pop in 1993/4: 23% old, 23% unemployed, 21% workers with low incomes
Social Security: L2: Reforms Types of reform 1. Conditional on income (means tested) 2. Conditional on characteristics of individuals 3. Mixed schemes 1. Negative income tax T = tax paid(>0 or <0) Y = income pre tax p= income post tax B = breakeven income t = tax rate T = t(Y-B) or T = tY - G, G = tB (= lump sum transfer) If T = 0, p = G/t Implies For a given t, an increase in G increases p For a given G, an increase in t decreases p
NIT Post tax income, p = (1-t')y + G, t’<t = (1-t)y + G’ = (1-t)y + G G’ G G/t' G/t Pre tax income, Y
Problems of NIT • (i) If G low, t low, but transfer insufficient • (ii) The higher the number of poor, the lower G for a given t • NIT schemes raise explicit tax rates • (a) MTR poor: poverty trap institutionalised • (b) MTR rich: potential labour supply problem • Extent redistribution depends on: • (a) shape of income distribution and B • (b) level of benefits
Type of reforms 2 Categorical benefits • If categories are exogenous and poverty occurs only in these categories, targeting is efficient • Lower admin. costs than means testing • Higher take up rates (1984 50% family credit, 100% child benefit) • Problems: exogeneity of categories characteristics may not be necessary condition for poverty (failure of Beveridge assumptions) equity
Type of reforms 3 Mixed Strategies • (i) Integrate national insurance and income tax and improve benefits for low income families and elderly • (ii) Atkinson (1992) a) means testing incentive effect b) Strengthen social insurance c) Add basic income - complement social insurance for workers
‘In-Work’ benefit Reforms • Policies designed to alleviate poverty in families s.t. ‘poverty trap’ - high implicit tax rate as benefits withdrawn. Returns to work for low skilled falling • In work programmes target low income families enforcing a work eligibility scheme (single parents and low income families e.g. WFTC, EITC) • Do they increase participation, hours, and for whom? • Issues in design
Nature of programmes • Aim to counter low wages and high tax rates of those on welfare • Payments depends on income earned and number of children • WFTC: eligibility minimum weekly hours (16 hours per week), family paid a credit upto a max amount which depends on number of children, as incomes rise credit is withdrawn at 55%, child care credit of 70% childcare costs upto max £100 per week, 150 for two children. • Increases incentives for work for single parents; decreases incentives in couples where the male works 40 hours per week
Evaluating ‘in-work’ programmes • Methods of evaluation - randomised control experiment - natural experiment (difference-in-difference method) • assumes (a) common time shocks (b) no compositional change within groups over time • implies choice of control group very important (e.g. in UK not all single women without children as participation is already very high).
Evaluation results • Evaluation WFTC using simulations (Blundell 2000) • lone parents: increases participation (2.2 sample move from no work to some); some reduction in hours • women with employed partners: 0.57% reduction in women in work, slight fall in hours (greater generosity of tax credit increases household income, which would be lost is the women is to work; WFTC increases household income if women were to stop work) • women with unemployed partners: 1.32% increase in participation • no overall impact on male employment (some fall where partner working, some increase where partner not working) • Similar positive results for EITC in USA
Design issues • Period of assessment and eligibility • Household allocation of income (benefits moved from mother to main earner) • Impact on gross wage of those in receipt of in work benefits (minimum wages shared with employers) • Impact on childcare market (assumes can find child care) • Choice of credit (or benefit) reduction rate • if high then encourages individuals to move into partime work • if low, then benefits accrue to high income earners • Minimum hours limits (leads to bunching)