Download
1 / 128
1.35k likes | 1.65k Views
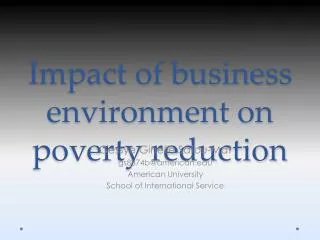
Impacts of social protection on poverty reduction. Social Security Summer School, ILO-ITC Turin Elective Course 13 Week 2, Monday to Wednesday 3-5 October 2011, 14:00-17:00 Florence Bonnet and Christina Behrendt ILO Social Security Department, Geneva.

E N D
Impacts of social protection on poverty reduction Social Security Summer School, ILO-ITC Turin Elective Course 13 Week 2, Monday to Wednesday 3-5 October 2011, 14:00-17:00 Florence Bonnet and Christina BehrendtILO Social Security Department, Geneva
A. Introduction 0. Quick overview Objectives and structure of the seminar
Impact of cash transfers on the reduction of poverty: A quick overview Objectives Overview of the potential and limitations of micro-simulations in the assessment of the possible impact of social transfers on poverty reduction Includes some conceptual thinking behind (poverty concepts and measurement etc.) In practice... Requirements: data needs (which survey types usually contain the necessary information; how to find them; and how to use them?) Assessment of possible impacts principles, steps, hypotheses, interpretation, limitations
Outline of the course • Introduction 0. Quick overview: objectives and structure of the seminar • Linking poverty outcomes to policies: Social security programmes and poverty reduction • Elements of a wider process: country-level rapid assessment • Some basics • Poverty and inequality: concepts and measurement • Preparatory work for hands-on session • Simulating the possible impact of cash transfer programmes • Hands-on exercises and discussion • Scenarios and group work • Presentations of group work results and discussion • Presentation of more examples and discussion • Working with survey data and other useful sources Day 1 Day 2 Day 3
A. Introduction 1. Linking poverty outcomes to policies: Social protection programmes and poverty reduction
1.1Evaluating the effects of social transfers on living standards Ex-post assessment: Analysis of existing programmes or social securitysystems Effectiveness: Does the programme reachits objectives? Efficiency: Does the programme achieveits objectives in an optimal way? Ex-ante assessment: Preparing future reforms Adjustingparameters of existing programmes Designing new social securitybenefits/schemes Enhancing the coordination betweendifferentschemeswithin a social security system
1.2Evaluating the effects of social transfers on living standards: Ex-post assessment (1) Ex-post assessment: Analysis of existing programmes Effectiveness: Does the programme reach its objectives? Coverage: e.g. which proportion of elderly receives an old age pension? Benefit levels and effects: e.g. effects of old age pensions on living standards of pensioners; effects of social assistance on overall poverty reduction
1.3Evaluating the effects of social transfers on living standards: Ex-post assessment (2) Efficiency: Does the programme achieve its objectives in an optimal way? Coverage: Are benefits going to those who should receive them? (inclusion/exclusion errors) Benefit levels and effects: Are benefit levels adequate to reach objectives? Costs: Does the programme reach its objectives in a cost-effective way?
1.4Evaluating the effects of social transfers on living standards: Ex-ante assessment (1) Ex-ante assessment: Preparing for future reforms Adjusting parameters of existing programmes How can the coverage of a social insurance scheme can be extended to still uncovered groups of workers? Which benefit levels should be provided in order to effectively prevent poverty? Designing new social security benefits/schemes How could a new social pension programme be designed? What is the most effective way to introduce child benefits? Enhancing the coordination between different benefits within a social security system Identifying undue cumulation of benefits and coverage gaps
1.5Evaluating the effects of social transfers on living standards: Ex-ante assessment (2) Relevance of ex-ante assessments for establishing national social protection floors Identifying effective ways to close coverage gaps Assessing the possible impacts of a set of basic social security guarantees on poverty reduction Assessing the interplay between different programmes and identifying gaps Assessing several options for benefit levels and their impact on poverty reduction Assessing the cost of a proposed reform and its possible impact
1.6Ex-ante assessment of impacts (1) Ex-ante assessment of the impact of cash transfers on the reduction of poverty is.... a static micro-simulation of the (direct) impact of transfers on individual/household income/expenditure and poverty status And is not.... a full assessment of the impact which would take into account changes in people’s behaviour and further socio-economic effects a Poverty Impact Assessment / Poverty and Social Impact Assessment (WB, OECD and others)
Example:Tanzania Source: Gassmann, F. and Behrendt, C., 2006: Cash benefits in low-income countries: Simulating the effects on poverty reduction for Senegal and Tanzania, Issues in Social Protection Discussion Paper (Geneva: International Labour Office).
The basic idea income post-reform income minimum income threshold pre-reform income households
1.7 Ex-ante assessment of impacts (2) Why conducting ex-ante assessments of impacts? Estimating the likely effects of future reforms on people’s incomes Testing different reform options ... without hurting anyone... Reflecting the interplay of different programmes with household structures, employment, wages etc. Enhancing the effectiveness of future reforms Preconditions Know how.... Availability of good survey data (see next section...)
Introduction • 2. Element of a wider process • Rapid assessment at the country level
Poverty impact | The process The impact assessment is one element of a wider process Identification of coverage gaps and needs Costing exercise to close the coverage gap Assessment of the potential impact of different options on the reduction of poverty Feeds into national discussions National dialogue including social partners and other stakeholders Leading to a national social security extension strategy Aiming at building a national social protection floor… …progressively extending social security in line with national conditions Iterative process Sequential adaptation of assessment during the dialogue process to take into account new options considered
Identify designgaps (population not covered due to the lack of SP policy / legislation • Identify implementationgaps: dysfunction in existing policy and schemes (entitlements not meet, unavailability or lack of access to services • Basis for the preliminary costing and thr analysis of potential impacts on poverty reduuction A consistent framework where all schemes and UN agencies support interventions can fit. Mapping & sharing of responsibilities and activities among actors and more specifically One UN Describe the present and planned social protection situation, taking into account SP strategy objectives Social Protection Floor template: guarantees and objectives Priority policy options to be decided through national dialogue on assessment results Assessment Matrix: structure
The purpose of the assessment • Key questions • Is there a SPF or some elements of the SPF in this country? 1. Inventory of schemes for the four guarantees: health, children, working age, elderly & disabled • How far has a country advanced in the implementation of the floor? 2. Analysis & identification of gaps • If the government plans to further develop its SPF, what should be done? 3. Recommendations • How much would it cost and what would be the impact in terms of the reduction of poverty and inequality? 4. Scenarios, costing and respective impacts
Vietnam Assessment Matrix Main results (1) Income security for children • Higher poverty rate than the overall poverty rate (22% against 14.5% on average) • Provision of various benefits: • Under regular social assistance schemes and the National Targeted Programme for Poverty Reduction (NTP-PR) few beneficiaries and low resources • Specific programmes such as • school fee exemptions and reductions for poor students. Over 10 per cent of children attending school benefiting • Loans for food for students living in poor households • Support for minority children for food, textbooks, notebooks • Health coverage under 6 years (included under health) • … but no general child benefit Health for all • Policy fullydeveloped to achieve population coverageuntil 2014 • No design gap as far as policyisconcerned • But someimplementation gaps: • Atpresent 60% covered but no clear solution for the implementation the remaining 40% uncovered; • lack of comprehensive analysis of the delivery or supply of services (quality, availability and geographical access); and • need for a proper registration, data collection and monitoring system
Vietnam Assessment Matrix Main results (2) Income security for the elderly • Some benefits provided through: • Contributory pension covering 18% of the working age • 20% of the 55/60+ receive an old age pension) • Targeted social assistance for the 80+ • Some design gaps for the persons aged 60-80 not covered by the contributory pension and the various targeted programmes groups under the NTPs • Some implementation gaps • Non contributory pension: • closed to 40% of entitled beneficiaries not covered and • Low level of benefit = 2/3 of the poverty line • Under-declaration of wage level among formal workers Income security for people in working age • Some design gaps • Unemployment insurance covering 10% of the labour force (limited to formal employment in enterprises of 10 or +) • maternity protection: 18% of the labour force (not all workers in formal employment) • Social assistance for the disabled and single parents: low coverage and minimal benefit (only 32,5% of the poverty line) • Some targeted programmes: housing and food support for minorities; and • Benefits to people with national merit • But no general income support for workers in informal employment • Recommends to study the experience of India (100 days employment scheme)
B. Some basics 3. Poverty and inequality: Concepts and measurements
3.1Income and poverty| Definitions Poverty measures can be grouped into four major categories: Economic:mainly monetary indicators of household well-being, particularly food and non-food consumption or expenditure and income. Social: Other non-monetary indicators of household well-being such as quality and access to education, health, other basic services, nutrition and social capital. Demographic: These indicators focus on the gender and age structure of households, as well as household size Vulnerability: focus on the level of household exposure to shocks that can affect poverty status, such as environmental endowment and hazard, physical insecurity, political change and the diversification and riskiness of alternative livelihood strategies. Focus
3.1Income and povertyHow to measurepoverty? What are the respective advantages and disadvantages of different poverty concepts? Which resources are assessed? Consumption Income Assets Multidimensional deprivation How are they assessed? Objective measures Subjective measures How to draw the line? Absolute poverty line Relative poverty line
3.1Income and povertyExamples of indicators and tools Income and consumption expenditure level and distribution: Quintiles, deciles, etc Gini coefficient Poverty monetary main indicators Poverty headcount (poverty rate) Percentage of population below food poverty line Percentage of the population below the basic needs poverty line Poverty gap Poverty squared gap
3.2Income&Poverty | Indicator of distributionExpenditure or Income quintiles / quartiles /deciles • “Quantiles” are a set of 'cut points' that divide a sample of data into groups containing (as far as possible) equal numbers of observations. • Main steps • Divide population into ‘groups’ ranked from ‘poorest’ to ‘richest’ based on expenditure (or income) • Divide into 4 groups (25% of the population each): quartiles • Divide into 5 groups (20% of the population each): quintiles • Divide into 10 groups (10% of the population each): deciles • Sum for each group (equal proportion of the population) the total consumption (or income) • Calculate the share of the consumption expenditure for each specific group (quintile, quartile or decile) to the total consumption expenditure or income • Usual indicators • Last quintile/decile - richest fifth/tenth of the population • First quintile/decile - poorest fifth/tenth of the population • Ratio Q5:Q1 for quintiles or Q4:Q1 for Quartiles
3.2Income&Poverty | Gini Coefficient Definition Cumulative share of income earned (or expenditure) (Yi) 10% 10% Cumulative share of people from lowest to highest incomes (Xi) • Gini coefficient or gini index • The Gini index summarizes how equal or unequal income or expenditure distribution is. • Gini index is calculated on a per capita basis • Higher values indicate greater inequality. • A Gini index of zero represents perfect equality and 1, perfect inequality. • The Gini index measures the area between the Lorenz curve and the hypothetical line of absolute equality, expressed as a percentage of the maximum area under the line. G = 1 – 2B
3.2Income&Poverty | Gini Coefficient Urban versus rural Inequality is highest in urban areas, lowest in rural areas While poverty rates decrease notably in rural areas, inequalities increase over time
3.3 Income&Poverty|PovertymonetaryindicatorsDefinitions Poverty headcount index (or poverty rate) the headcount index estimates the percentage of the population living in households with per capita consumption expenditure (or per equivalent adult) below the poverty line. it measures the incidence of poverty Poverty gap The Poverty Gap Index expresses the total amount of money which would be needed to raise the poor from their present incomes (c) to the poverty line (z), as a proportion of the poverty line, and averaged over the total population, which measures the depth of poverty The aggregate poverty gap shows the cost of eliminating poverty by making perfectly targeted transfers to the poor. This total cost can be related to GDP. The squared poverty gap measures the severity of poverty as the poorest households are given a greater weight in the equation.
Poverty rate = Q/N With Q = total number of poor Poverty gap index = 1/n*[(z-c)/z] Squared Poverty gap = 1/n* [(z-c)/z]2 q q c<z c<z 3.3Income&Poverty|PovertymonetoryindicatorsCalculation • Poverty rates, poverty gap and squared poverty gap formulae can be represented as follows: where • n represents the total population, • q the poor • z the poverty line and • c consumption expenditure • If the parameter α = 0, then the equation is simply the headcount index. • With α = 1, the equation measures the poverty gap, which is the average income / expenditure shortfall of the poor with respect to the poverty line. • When α = 2, the equation represents a measure for the severity of poverty
3.3. Poverty |Poverty rates in Viet Nam (1) Poverty rate by urban rural and region calculated by income (Government poverty line) Food poverty line New Government poverty line adopted in 2006 and reported in 2004 for poverty rate calculation
3.3. Poverty |Poverty rates in Viet Nam (2) General poverty rate by urban rural and region calculated by expenditure Exercise based on this one
Equivalence scales • How to account for economies of scale? • Household income • Equivalized income (how?) • Per capita income • Choice of scale may have strong effects on measured poverty, especially for sub-groups of the population • Examples of equivalence scales: • “classical OECD scale”:head: 1, other adults: 0.7, children: 0.5 • “modified OECD scale”:head: 1, other adults: 0.5, children: 0.3 • square root scale: (number of hh members)0.5 • More general: income / (hhsize)e
Equivalence scales: Effects on measuredpoverty rates Source: Behrendt, C., 2002: At the Margins of the Welfare State: Social Assistance and the Alleviation of Poverty in Germany, Sweden and the United Kingdom (Aldershot: Ashgate).
Poverty gaps | Vietnam • General poverty gaps (calculated by expenditure)
Poverty profile • Objectives • Analysing the relationship between poverty rates and household’s or individual’s characteristics • Demographic and composition of the household • Situation in the labour market • Housing conditions and access to basic services • Developing a picture of who are the most exposed to poverty • Comparison of poverty rates and poverty gaps between different groups of the population
Poverty profile | Poverty rates & socio-democharacteristics– Vietnam Poverty rates by age range: highest poverty rates among children (especially <6) Poverty rates in the population aged 6+ not working: highest risk of poverty among disabled Poverty rates in the population aged 6+ working: higher general poverty rate than the non working Highest poverty rates among the self employed in non registered enterprise (65% of total employment, 72% in rural areas) and people working for other households (16%)
Poverty profile |Poverty rates by age and area of residenceVietnam Higherpoverty rates in rural areas: between 5 to 7 times higherthan in urban areas Typical U curve with higher poverty rates among children and elderly
B. Some basics 4. Preparatory work for hands-on session: How to become familiar with Excel formulas
Click session | Quiz • Question 1 | Would you say that Excel is • Your favourite software… and has no secret for you • Some horizontal and vertical lines • Nice to do tables… possibly with one or two “=“ or “+” • …. ?? Is it a new Hollywood master production? • Question 2 | Definition of a formula • A formula is a mathematical equation used to calculate a value • Can be conditional • Can be used to aggregate or redistribute values • A formula can be ... magic • None of the above • 4 of the above
Quick exercice (1) | Context • We — the happy participants to the course n°13 — have the pleasure to celebrate our new ability to measure impact on poverty reduction of social security benefits and enjoy a delicious dinner Antipasti, Primi Piatti, Secondi Piatti and Dolci della Casa in Turnino… • Difficult to resist! Result: an impressive bill …. far too big to be paid by a single person and still many participants do not have Euros (not yet or not any more) • Solution by “speciality”: the bill is split between 3 persons by type of dishes • José Manuel covers all Antipasti (1) • Jane Chantal the Primi Piatti (2) Secondi Piatti (3) and…… • Chico the Dolci della casa (4) and drinks (5)….
Quick exercice (2) | Context Please go into Excel file….. It is just training in prevision of tomorrow session • The bill, basis of the exercise has • Five different colours = five codes • Antipasti in blue • PrimiPiatti in red • SecondiPiatti in green • Dolcidella casa in purple • Drinks in orange The Menu …… purely informative
Quick exercice (3) | Questions • =SUM(C6:C50) • Yesterday night unfortunately the restaurant’ cash register has been stolen…. there is a computer with Excel but the owner of the restaurant was not available to participate in this course… so no total bill is provided but only the detailed dishes prices… • Question 1Please calculate the sum of the total bill
Quick exercice (2) | Questions • =IF(E6=1,1,0) and =IF(AND($E6=2,$E6=3),1,0) =IF(OR($E6=4,$E6=5),1,0) Alternative not used here =IF(OR($E6=2,$E6=3),1,0) • Question 2Based on the codes indicated in the excel file, identify the respective “dishes” to be paid respectively by José Manuel (1), Jane Chantal (2) & (3) and Chico (4) et (5) • = “simple formula” = $C6*F6 • Question 3 After identification in question 2, allocate the amount by dish to the three “payers” … to sum the total amount to be paid respectively by José Manuel, Jane Chantal and Chico
Quick exercice (4) | Useful formula SUMIF Question 4: Calculate the total amount to be paid respectively by José Manuel, Jane Chantal and Chico How to? In Excel, the SumIffunction adds all numbers in a range of cells, based on a given criteria. Generic syntax: SumIf ( range, criteria, sum_range) range is the range of cells that you want to apply the criteria against (e.g code of type of dishes or code of household associated to each dish) criteria is used to determine which cells to add (e.g. list of codes for type of dishes). sum_range are the cells to sum (amount per dish)
Quick exercice (5) | Useful formula SUMIF Applications: 2 options …. both will be used tomorrow Option 1 [in Bill (original)]=SUMIF(F6:F43,"=1",$C$6:$C$43) Sum the amount of dishes allocated to each of the 3 people in question 2 by column Option 2 [in Dishes category (original)] =SUMIF ('Bill (original)'!$E$6:$E$43,$C$6:$C$10,'Bill (original)'!$C$6:$C$43) 'Bill (original)'!$E$6:$E$43: column of codes for each types of dishes (from 1 to 5) in ‘Bill (Original)’ sheet $C$6:$C$10 Column with 5 values = list of individual codes for types of dishes in ‘Dishes category (original)’ $C$6:$C$43 Column of respective prices for dishes
Quick exercice (6) | Question 5 — redistribution VLOOKUP SituationItaly just wins the football world cup and to celebrate this great news, the Ristorante Il Leccio offers a percentage reduction by type of dishes Question 5Reallocate for each dish the percentage reduction applied depending to the category it belongs to
VLOOKUP | Redistribution of per capita value of benefit to eachindividual HH member (1) ObjectiveSearches for a value in the first column of a table array and returns a value in the same row from another column in the table array. The V in VLOOKUP stands for vertical. Use VLOOKUP instead of HLOOKUP when your comparison values are located in a column to the left of the data that you want to find. Syntax: =VLOOKUP(lookup_value,table_array,col_index_num,range_lookup) Lookup_value The value to search in the first column of the table array Table_array Two or more columns of data. Use a reference to a range or a range name. The values in the first column of table_array are the values searched by lookup_value. These values can be text, numbers, or logical values. Col_index_num The column number in table_array from which the matching value must be returned Range_lookup A logical value that specifies whether you want VLOOKUP to find an exact match or an approximate match (use FALSE)
C. Simulating the possible impact of cash transfer programmes 5. Hands-on exercises and discussion