Download
1 / 23
230 likes | 387 Views
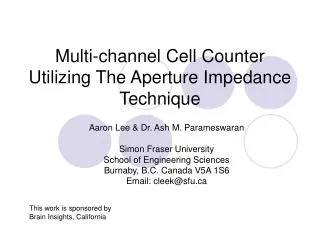
Measuring Impedance Across the Channel of a Biodevice. Presented by: Kaidi He August 24, 2007 Mentors: Prof. Reginald Penner Li-Mei Yang. Outline. Project Overview Methods Device Fabrication Experimental Setup Procedures Data and Analysis Conclusion. I. Project Overview.

E N D
Measuring Impedance Across the Channel of a Biodevice Presented by: Kaidi He August 24, 2007 Mentors: Prof. Reginald Penner Li-Mei Yang
Outline • Project Overview • Methods • Device Fabrication • Experimental Setup • Procedures • Data and Analysis • Conclusion
I. Project Overview • Measure impedance across the channel of a biodevice for different channel widths exposed to various concentrations • Construct a calibration curve Courtesy of Prof. Penner
II. Methods, (a) Device Fabrication SU8 Au Glass Au Exposure Development SU8 Au etch SU-8 Au A. Au glass A. B. SU-8 Courtesy of Li-Mei Yang B.
S • Original: • Nickel • Wire attachments • Silver contacts • Final: • Gold with silver contacts
b. Experimental Setup reference electrochemical cell working
5.00e-6 E-1 Nyquist Plot: Zim vs. Zre
EIS H2O 5E-4M NaCl x3 EIS EIS 5E-1M NaCl 5E-4M NaCl x3 EIS EIS EIS EIS EIS EIS 0.1 – 5e-6 M NaCl (3) Procedures Courtesy of Li-Mei
3rd 2nd 1st III. Data and Analysis, (1) Stability of Device
EIS H2O 5E-4M NaCl x3 EIS EIS 5E-1M NaCl 5E-4M NaCl x3 EIS EIS EIS EIS EIS EIS 5E-1-5E-6M NaCl Courtesy of Li-Mei
(2) Alternating, ZRe, Low and High Concentrations 5E-4 M 5E-1 M
5E-4 M 5E-4 M 5E-1 M
Low concentration, more noise • Low frequency, more noise
EIS H2O 5E-4M NaCl x3 EIS EIS 5E-1M NaCl 5E-4M NaCl x3 EIS EIS EIS EIS EIS EIS 5E-1~5E-6M NaCl Courtesy of Li-Mei
(3) Random Sampling • As expected, increasing concentration results in decreasing resistance
Λ = Λº - (A+B Λº)c1/2 for c< 0.001 mol/L Λ = equivalent molar conductivity Λ º = equivalent molar conductivity at infinite dilution A = 60.20 B = 0.229 C = electrolyte concentration Λ = κ/ceq Ceq = c|z| • Plotting Λ against c1/2 will be linear…
IV. Conclusion • We have achieved our goal of constructing a calibration curve which will allow us to know concentration with a device of given channel width and impedance across the channel • With photolithography, we are able to construct miniaturized conductivity cells quantitatively follow the Debye-Huckel-Onsanger Equation and operate best at large interelectrode spacings • This most likely will lead to their functioning as biosensor transducers in the future
Acknowledgments • Thank you to Prof. Penner, Li-Mei Yang, Keith Donovan, Travis Kruse, Dat Hoang, Said Shokair, IM-SURE, and NSF for their guidance and support