Service Availability Calculation Methods at WLCG Workshop, CERN
Discusses old and new algorithms for calculating service availability based on continuous and discrete time scales. Compares reliability metrics and handling of test results in case of scheduled downtime. Highlights accuracy improvements in the new algorithm.

Service Availability Calculation Methods at WLCG Workshop, CERN
E N D
Presentation Transcript
Service Availability Calculation Methods • Piotr Nyczyk • WLCG Service Reliability Workshop • CERN, 26-30 November 2007
SAM tests (VO-specific) SAM tests (VO-specific) Current availability calculation • SAM stores raw test results for all VOs in the DB • GridView implementation of status and availability calculation algorithm (next slides) • One list of critical tests per VO • Efficient (?) calculation - working directly on the DB (SQL statements) • Continuous time scale for status calculation (no sampling) SAM tests (OPS) SAM Summarisation module
Two algorithm implementations • Old algorithm (not used any more) • Computes Service Status on Discrete Time Scale with precision of an hour • Test results sampled at the end of each hour • Service status is based only on latest results for an hour • Availability for an hour is always 0 or 1 • Drawbacks of Discrete Time Scale • Test may pass or fail several times in an hour • not possible to represent several events in an hour • loss of precise information about the exact time of occurrence of the event • New Algorithm (current) • Computes Service Status on Continuous Time Scale • Service Status is based on all test results • Computes Availability metrics with higher accuracy • Conforms to Recommendation 42 of EGEE-II Review Report about introducing measures of robustness and reliability • Computes reliability metrics as approved by LCG MB, 13 Feb 2007 Service Availability Calculation Methods, WLCG Service Reliability Workshop, 26-30 November 2007
Major Differences • Major differences between old and new algorithm • Service Status computation on Continuous time scale • Consideration of Scheduled Downtime (SD) • Service may pass tests even when SD • Leads to Inaccurate Reliability value • New algorithm ignores test results and marks status as SD • Validity of Test Results • 24 Hours for all tests in old case • Defined by VO separately for each test in New method • Invalidate earlier results after scheduled interruption • Handling of UNKNOWN status Service Availability Calculation Methods, WLCG Service Reliability Workshop, 26-30 November 2007
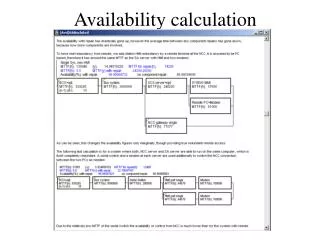
Computation of service instance status : Difference between old (current) and new algorithm Up Test result considered invalid after a VO-specific timeout Down Unknown Scheduled Down Scheduled Downtime 0 1 2 3 4 5 6 7 8 9 10 11 12 13 14 test1 test2 test3 test4 Old algo New algo Two tests failed but old algorithm shows service UP because only final tests in the hour are considered One test failed at the end of the hour but old algorithm shows service DOWN because only final tests in the hour are considered All results available and tests passed. No difference between old and new algorithms Status UP as tests are passed even when scheduled Down, results in inaccurate reliability value Service instance is marked as scheduled shutdown. Result of test4 is unknown. The old algorithm ignores this, whereas the service instance is marked ‘unknown’ in the new algorithm All earlier test results are invalidated and treated as unknown at the end of a scheduled shutdown in the new algorithm. In the new algorithm, status is based on all the test results and is more accurate representation of the true state of the service Coarse granularity: Status change only at hour boundaries Finest granularity: Status can change at any moment, instantaneously Service Availability Calculation Methods, WLCG Service Reliability Workshop, 26-30 November 2007
ANDing all service statusesup→up at least one service status down→down no service down and at least one is sd→sd no service down or sd and at least one is unknown→unknown consider only critical tests for a vo Service & Site Service Status Calculation Service Instance Status SiteStatus Test Results ServiceStatus ANDing Service marked as scheduled down (sd) →sd all test statuses are ok→up at least one test status is down(failed)→down No test status downand at least one test status is unknown→unknown ORing At least one service instance status up→up No instance up and at least one is sd→sd No instance up or sd and at least one instance is down→down All instances are unknown→unknown (new algorithm) aggregatetest status aggregatesite service status aggregateservice instance statusfor site services test status per (test, si, vo) per (site, service, vo) per (site, vo) per (si, vo) Service = a service type (e.g. CE, SE, sBDII, ...) Serviceinstance (si)= (service, node) combination Service Availability Calculation Methods, WLCG Service Reliability Workshop, 26-30 November 2007
Limitations • Only one list of critical tests per VO used for everything: • availability metric (reports) • operational alarms • BDII exclusion using FCR • Consequence: only one target metric per VO - simply “availability” (plus “reliability”) • Completely uniform: • all sites treated in the same way (Tier 0,1,2)
Additional requirements • Different criticality targets in several dimensions • metric usage: availability report, alarms, BDII exclusion • application domain or functionality: simulation, reconstruction, analysis, ... (VO dependent) • Service and site categorisation: tier 0, 1, 2, ... (depending on computational model) • More complex status calculation logic: • OR expressions on tests aggregation (not only simple AND of critical tests) • additional factors (not known at design time) • Distributed sites or tier centres as metric targets
Current workarounds • “Intelligent tests” - varying results on site role • masking failures of Tier-1 related tests on Tier-2 sites • additional knowledge and logic needed by the test (where from?) • Disadvantages: complex tests, mixing tests with results analysis • Externally calculated availability • get raw test results using SAM API (last hour/day) • calculate customised metrics • store in own DB (experiments dashboards) • Disadvantages: additional data transfers, storage redundancy (synchronisation?), no feedback to SAM
Future - Solution 1 • Messaging system (MSG) as monitoring data exchange bus • all tests published to a common messaging system as metrics (SAM and other monitoring tools) • everyone can subscribe - multicast approach to distribute raw results to many repositories • distributed and decentralised calculation of derived metrics by customised summarisation components • derived metrics re-published to the messaging system • SAM/FCR can subscribe to various derived metrics for different purposes: • alarm metric • availability metric (report) • BDII exclusion triggering metric • Advantage: best flexibility and scalability, possible decentralisation of SAM/GridView • Challanges: need for robust messaging (additional effort), dealing with message latencies (on-line summarisation, delay loop?)
Future - Solution 2 • Refactored SAM/GridView summarisation algorithm • stay within SAM/GridView DB and GridView summarisation component • brake current availability metric into many VO-dependent and named metrics • provide a flexible way (language) to define metric calculation rules • expose interface to define new metrics but calculate them all in situ • expose API to access calculated metrics • Advantages: uniform software, standardisation • Disadvantages: possible loss of flexibility, centralisation, scalability?
Future - Solution 3 • SAM/GridView as monolith (+ current workarounds) • raw test results published only to SAM DB • replicated to remote data stores / metric calculation components using periodic API queries • incremental updates (new results in last hour) • metrics calculated by customised remote summarisation modules • metric results published back to SAM (how?) • Advantages: least effort, possible migration to solution 1 • Disadvantages: ineffective, centralised, significant latencies - can be considered only as an intermediate solution (!)
General observations • Breakdown of “availability metric” into several specific metrics is needed anyway • Robust and scalable messaging layer allowing multicast publishing is unavoidable in longer term • General understanding of which metrics are really needed and what they represent is crucial (not to get lost in plenitude of meaningless metrics) • Decentralisation and distribution of current SAM/GridView system is probably a good move
Questions • Which solution to chose? • What are exactly the requirements? (we need to build a list) • Do we agree on common formats? • message format • monitoring data exchange / queries • Will all new availability/reliability metrics become just normal metrics? (as defined by the WLCG Monitoring WG) • Who will do this?