Download
1 / 37
380 likes | 427 Views
Understand polynomial functions, power functions, and rational functions through examples and key concepts. Learn about degrees, turning points, asymptotes, and graphing techniques.

E N D
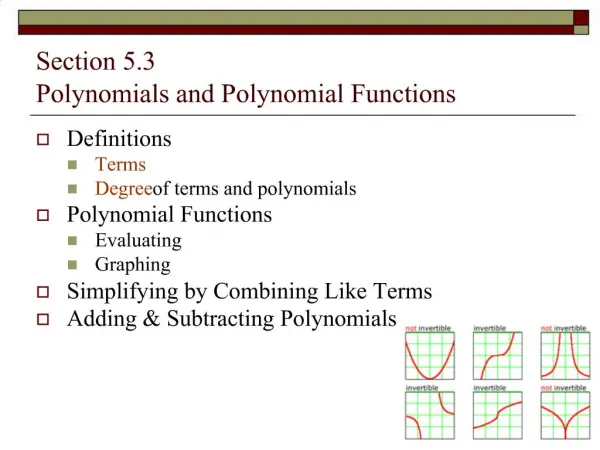
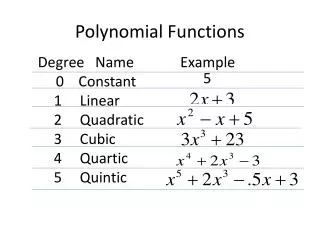
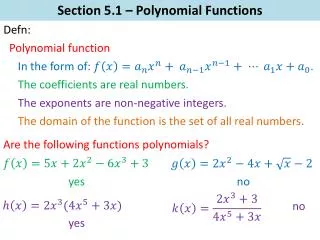
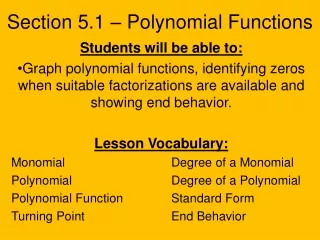
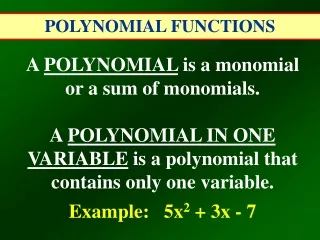
A polynomial function is a function of the form an , an-1 ,…, a1 , a0are real numbers n is a nonnegative integer D: {x|x å real numbers} Degree is the largest power of x
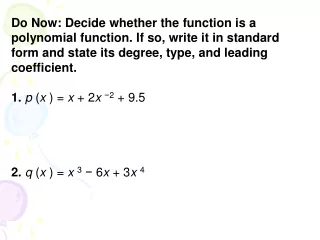
Example: Determine which of the following are polynomials. For those that are, state the degree.
A power function of degree n is a function of the form where a is a real number a = 0 n > 0 is an integer.
(-1, 1) (1, 1) (0, 0) Power Functions with Even Degree
Summary of Power Functions with Even Degree 1.) Symmetric with respect to the y-axis. 2.) D: {x|x is a real number} R: {x|x is a non negative real number} 3.) Graph (0, 0); (1, 1); and (-1, 1). 4.) As the exponent increases, the graph increases very rapidly as x increases, but for x near the origin the graph tends to flatten out and lie closer to the x-axis.
Power Functions with Odd Degree (1, 1) (0, 0) (-1, -1)
Summary of Power Functions with Odd Degree 1.) Symmetric with respect to the origin. 2.) D: {x|x is a real number} R: {x|x is a real number} 3.) Graph contains (0, 0); (1, 1); and (-1, -1). 4.) As the exponent increases, the graph becomes more vertical when x > 1 or x < -1, but for -1 < x < 1, the graphs tends to flatten out and lie closer to the x-axis.
(1,1) (0,0) (0,0) (1, -2) Graph the following function using transformations.
(1, 4) (1,0) (2, 2) (2,-2)
If r is a Zero of Odd Multiplicity If r is a Zero of Even Multiplicity Graph touches x-axis at r. Graph crosses x-axis at r.
2 f ( x ) = x + 1 x - 5 x + 4 For the polynomial ( ) ( ) ( ) (a) Find the x- and y-intercepts of the graph of f. The x intercepts (zeros) are (-1, 0), (5,0), and (-4,0) To find the y - intercept, evaluate f(0) So, the y-intercept is (0,-20)
2 f ( x ) = x + 1 x - 5 x + 4 For the polynomial ( ) ( ) ( ) b.) Determine whether the graph crosses or touches the x-axis at each x-intercept. x = -4 is a zero of multiplicity 1 (crosses the x-axis) x = -1 is a zero of multiplicity 2 (touches the x-axis) x = 5 is a zero of multiplicity 1 (crosses the x-axis) c.) Find the power function that the graph of f resembles for large values of x.
2 f ( x ) = x + 1 x - 5 x + 4 For the polynomial ( ) ( ) ( ) On the interval d.) Determine the maximum number of turning points on the graph of f. At most 3 turning points. e.) Use the x-intercepts and test numbers to find the intervals on which the graph of f is above the x-axis and the intervals on which the graph is below the x-axis. Test number: x = -5 f (-5) = 160 Graph of f: Above x-axis Point on graph: (-5, 160)
2 f ( x ) = x + 1 x - 5 x + 4 For the polynomial ( ) ( ) ( ) On the interval On the interval Test number: x = -2 f (-2) = -14 Graph of f: Below x-axis Point on graph: (-2, -14) Test number: x = 0 f (0) = -20 Graph of f: Below x-axis Point on graph: (0, -20)
2 f ( x ) = x + 1 x - 5 x + 4 For the polynomial ( ) ( ) ( ) On the interval Test number: x = 6 f (6) = 490 Graph of f: Above x-axis Point on graph: (6, 490) f.) Put all the information together, and connect the points with a smooth, continuous curve to obtain the graph of f.
(6, 490) (-1, 0) (-5, 160) (0, -20) (5, 0) (-4, 0) (-2, -14)
A rational function is a function of the form • p and q are polynomial functions • q is not the zero polynomial. • D: {x|x å real numbers & q(x) = 0}.
Find the domain of the following rational functions. All real numbers x except -6 and -2. All real numbers x except -4 and 4. All Real Numbers 30
Vertical Asymptotes. • Domain gives vertical asymptotes • Reduce rational function to lowest terms, to find vertical asymptote(s). • The graph of a function will never intersect vertical asymptotes. • Describes the behavior of the graph as x approaches some number c • Range gives horizontal asymptotes • The graph of a function may cross intersect horizontal asymptote(s). • Describes the behavior of the graph as x approaches infinity or negative infinity (end behavior) 31
Example: Find the vertical asymptotes, if any, of the graph of each rational function. Vertical asymptotes: x = -1 and x = 1 No vertical asymptotes Vertical asymptote: x = -4 32
(3,2) (0,1) (2,0) (1,0) In this example there is a vertical asymptote at x = 2 and a horizontal asymptote at y = 1.
y y = R(x) y = L x y y = L x y = R(x) Examples of Horizontal Asymptotes
Examples of Vertical Asymptotes x = c y x = c y x x
y x If an asymptote is neither horizontal nor vertical it is called oblique. Note: a graph may intersect it’s oblique asymptote. Describes end behavior. More on this in Section 3.4.
(1,1) (-1,-1) Recall that the graph of is 37
(1,1) (3,1) (2,0) (1,-1) (-1,-1) (3,2) (0,1) (2,0) (1,0) Graph the function using transformations
Consider the rational function 1. If n < m, then y = 0 is a horizontal asymptote 2. If n = m, then y = an / bmis a horizontal asymptote 3. If n = m + 1, then y = ax + b is an oblique asymptote, found using long division. 4. If n > m + 1, neither a horizontal nor oblique asymptote exists. 39
Example: Find the horizontal or oblique asymptotes, if any, of the graph of Horizontal asymptote: y = 0 Horizontal asymptote: y = 2/3
To analyze the graph of a rational function: 1) Find the Domain. 2) Locate the intercepts, if any. 3) Test for Symmetry. If R(-x) = R(x), there is symmetry with respect to the y-axis. If - R(x) = R(-x), there is symmetry with respect to the origin. 4) Find the vertical asymptotes. 5) Locate the horizontal or oblique asymptotes. 6) Determine where the graph is above the x-axis and where the graph is below the x-axis. 7) Use all found information to graph the function. 42
b.) y-intercept when x = 0: a.) x-intercept when x + 1 = 0: (-1,0) y - intercept: (0, 2/3) c.) Test for Symmetry: No symmetry
d.) Vertical asymptote: x = -3 Since the function isn’t defined at x = 3, there is a hole at that point. e.) Horizontal asymptote: y = 2 f.) Divide the domain using the zeros and the vertical asymptotes. The intervals to test are:
Test at x = -4 Test at x = -2 Test at x = 1 R(-4) = 6 R(-2) = -2 R(1) = 1 Above x-axis Below x-axis Above x-axis Point: (-4, 6) Point: (-2, -2) Point: (1, 1) g.) Finally, graph the rational function R(x)
x = - 3 (-4, 6) (1, 1) (3, 4/3) y = 2 (-2, -2) (-1, 0) (0, 2/3)