Analysis of BM-MSC Adipogenesis: Effects of FasL Treatment
Human BM-MSC batches #1, #2, and #3 were cultured in adipogenic medium for 14 days, and adipocyte percentage was determined. BM-MSCs were treated with FasL and analyzed for adipogenesis.

Analysis of BM-MSC Adipogenesis: Effects of FasL Treatment
E N D
Presentation Transcript
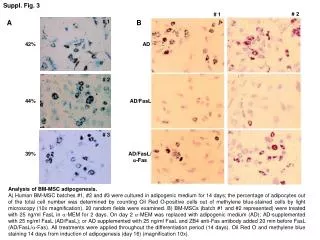
Suppl. Fig. 3 # 2 # 1 A # 1 B 42% AD # 2 44% AD/FasL # 3 39% AD/FasL/ a-Fas Analysis of BM-MSC adipogenesis. A) Human BM-MSC batches #1, #2 and #3 were cultured in adipogenic medium for 14 days; the percentage of adipocytes out of the total cell number was determined by counting Oil Red O-positive cells out of methylene blue-stained cells by light microscopy (10x magnification). 20 random fields were examined. B) BM-MSCs (batch #1 and #2 represented) were treated with 25 ng/ml FasL in a-MEM for 2 days. On day 2 a-MEM was replaced with adipogenic medium (AD); AD-supplemented with 25 ng/ml FasL (AD/FasL); or AD supplemented with 25 ng/ml FasL and ZB4 anti-Fas antibody added 20 min before FasL (AD/FasL/a-Fas). All treatments were applied throughout the differentiation period (14 days). Oil Red O and methylene blue staining 14 days from induction of adipogenesis (day 16) (magnification 10x).