Download
1 / 23
230 likes | 246 Views
Explore the principles of sedimentation velocity and the application of fluorescence-detected sedimentation using AU-FDS in various research scenarios. Learn about data collection, analysis, and examples from different fields.

E N D
Fluorescence detected sedimentation Applications using sedimentation velocity
Outline • Basics of sedimentation velocity • How the AU-FDS works • Applications • Examples of applications • Where it can take us
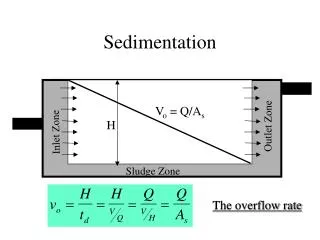
Types of sedimentation Graphs courtesy of Peter Schuck
AU-FDS opticsConfocal fluorescence optics PMT Laser Spatial filter Collimation Dichroic filter Dichroicmirror Expansion Objective lens Fluorescent event
One rotation Signal from samples Data CollectionOne radius, several rotations • Aviv AU-FDS • Rapid-scan absorbance FDS RSA FDS RSA Slit assembly Radial steps One rotation
Rotor timing pulse One rotation Intensity Intensity from sample 1 Data acquisition strategy • Aviv AU-FDS • Rapid-scan absorbance • Continuous light source • Acquire light intensities and rotor timing pulse • Asynchronous with rotor • Sort out the data in computer memory
Simultaneous dataacquisition • Aviv AU-FDS • Rapid-scan absorbance • FDS and RSA data • Data for all cells • Signal averaging 1 2 3
40 nM GFP in 100 mM KCl, 10 mM Tris, pH 8.0 40 nM GFP in E.coli lysate 100 nM GFP 100 nM Anti GFP in Human serum AU-FDS applications
Determining s and Mw 40 nM GFP in 100 mM KCl, 10 mM Tris, pH 8.0
Using a labeled lipid DPPC-NBD ± rsEPCR 400 nM DPPC-NBD + rsEPCR 20 mM Tris, 100 mM NaCl and 3 mM CaCl2, pH 7.5
Using a lipid label DPPC-NDB + rsEPCR rsEPCR + DPPC 2.87 s rsEPCR alone 2.63 s
Detecting trace molecule 40 nM GFP in varying concentrations of E. coli lysate
Repulsion STI Dextran HEL Attraction 40 nM GFP in concentrated solutions of different charge
Using labeled lipid in serum4M DPPE Albumin Free DPPE?
Alexa-488 IgG in serum 500 nM Alexa in TBS or human serum
40 nM GFP in serum Serum albumin
GFP/Anti-GFP in Human serum 100 nM GFP/100 nM Anti-GFP in Serum Rachel Kroe
Acknowledgements Rachel Kroe Brett Austin BITC Jeff Hansen CAMIS Borries Demeler NIH Edward Eisenstein NSF