Download
1 / 16
160 likes | 179 Views
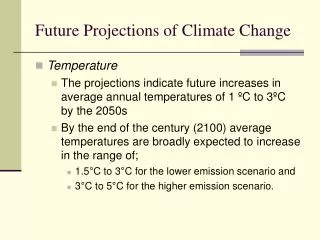
Explore the importance of chemistry-climate interactions in projecting future air quality, focusing on pollutants like ozone and PM2.5. Investigate how increasing temperatures, trends in stagnation, and wildfires will impact air quality. Assess the changes in air quality using chemistry-climate models and statistical models. Also, examine the projected increase in smoke and ozone episodes by 2050s in the US.

E N D
Importance of chemistry-climate interactions in projections of future air quality Loretta J. Mickley Lu Shen, Daniel H. Cusworth, XuYue Earth system models
How will surface air quality change in changing atmosphere? Number of people living in U.S. counties with air quality concentrations above the NAAQS thresholds in 2014 One or more pollutants Ozone (8-hour) PM2.5 (annual or 24-hour) PM10 (24-hour) How will these bars change in response to: • increasing temperatures? • trends in stagnation? • increasing wildfires in the West? ….. http://www3.epa.gov/airtrends/aqtrends.html
GDP Anthropogenic emissions 2014 1980 St. Louis Even as emissions decline, meteorology drives variability in air quality. Number of days MDA8 ozone > 75 ppb
Two ways to quantify air pollution in future climate. 1. Chemistry-climate models or chemistry transport models T, RH, etc. winds Winds carry pollutants. Emissions + chemistry calculated within box MDA8 ozone, JJA 2003-2012 Site in Maryland 2. Statistical models Construct relationships between meteorological variables and pollutants. Statistical relationships are then applied to ensemble of climate projections. mean One s Shen et al., in review
Statistical method to project future air quality can take advantage of large ensemble of climate projections. 2000-2050 2000-2050 change in different ecoregions oC D Temp JJA Temp (K) D Temp Close analysis reveals large spread among model projections. We can thus calculate statistical significance of results. Yue et al., 2013
1. Projections of wildfire activity and smoke concentrations over the western United States by 2050s Area burned over Southwest 1. Build statistical model of area burned using meteorological variables and fire indices. 2. Apply statistical model to CMIP3 climate projections. R2 ~ 0.5 observed Area burned (105 ha) model Timeseries of area burned model observed 3. Apply median areas burned for present-day and future into GEOS-Chem. Area burned (105 ha) Area burned in Southwest doubles by 2050. Yue et al., 2013, 2014, 2015
Many populous counties in the West experience 40-150% increases in smoke PM2.5 by 2050s. Percent increase in smoke PM2.5 by midcentury relative to 2000s, by county. Much of California sees a doubling of “smoke waves” – episodes of enhanced smoke at the 98th% level. • With collaborators from Yale, we are examining the health impacts using Medicare data. Yue et al., 2013, 2014, 2015 Large cities affected by fires Liu et al., in review
2. Projection of U.S. ozone episodes in 2050s atmosphere. location factor We build a model using extreme value theory. Probability of surface ozone above a specified threshold. Only meteorological variable considered is Tmax. shape factor scale factor Observed MDA8 ozone, JJA 2003-2012 Site in Maryland Model also needs to take into account the phenomenon known as “ozone suppression” at high maximum temperatures. mean One s Shen et al., in review
Ozone suppression at high temperatures is a widespread phenomenon across the United States. Sites demonstrating significant decrease in O3-max T slope at high temperatures. Steiner et al. (2010) found similar phenomenon in California. AQS Sensitivity studies with GEOS-Chem suggest the cause is due to the nonlinearity of meteorological effects on ozone during heatwaves. We include suppression in statistical ozone model and apply to 19 CMIP5 models. Shen et al., in review
Statistical model finds that number of surface ozone episodes per summer increases by 2050s. D episode days 2000-2009 vs 2050-2059 Mean change in ozone episode days due to climate change in by 2050s in RCP4.5 scenario. Episode = MDA8 O3 > 75 ppb Sites where inclusion of Tmax does not improve EVT model. Ozone episodes increase by 3-9 days yr-1 in Northeast and California. U.S. average change is ~2 days yr-1. Shen et al., in review
3. Improved projections of PM2.5 concentrations in 2050s. Here focus is on climate penalty on anthropogenic and biogenic PM2.5. Change in annual mean PM2.5 by 2050s Taietal.(2012) Newstudy, Lu Shen μg m-3 μg m-3 Note different color bars! Predictors:Local meteorology and regional scale circulation patterns Predictors:local meteorological variables New results suggest that annual mean PM2.5could increase 1-1.5 μg m-3 in the easternUS, larger than previous estimates.
Statistical model predicts different responses in different seasons for change in PM2.5 in 2050s atmosphere. ΔPM2.5 in JJA ΔPM2.5 in DJF μg m-3 μg m-3 Volatilization of ammoniumnitrate Fasteroxidationrate, more biogenic emission, and stagnation Lu Shen, work in progress
Dynamical models may have difficulty capturing observed sensitivity of monthly mean PM2.5 to temperature. Slopes of monthly mean JJA PM2.5vs surface temperatures observations another ACCMIP model ACCMIP model μg m-3 K-1 slope > 1 μg m-3K-1 within contour Lu Shen, work in progress We are investigating the mismatch with observed slopes in GEOS-Chem. Preliminary results point to problems in capturing the sensitivity of sulfate to temperature.
Take home messages. • Many populous counties in the West could experience doubling of smoke PM2.5 by mid-century. • Ozone episode days could increase by as much as 3-9 days per summer in the 2050s due to climate change. • Summertime PM2.5 concentrations could increase 3 mg m-3 by 2050s over much of the eastern United States. We are working with the CDC to put together an interactive website with these results.
Slope of monthly mean JJA PM2.5 and surface temperature. μg m-3 K-1 μg m-3 K-1 Observations GEOS-Chem