Download
1 / 5
50 likes | 169 Views
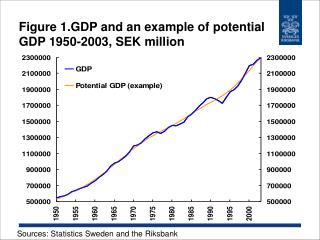
9,000. The orange line shows full-employment or potential output. 8,000. 7,000. Actual and Potential Real GDP (Billions of 1996 Dollars). 6,000. The green line shows actual output. During recessions, output declines. 5,000. 4,000. During expansions, output rises—sometimes rapidly.

E N D
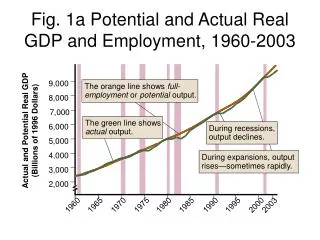
9,000 The orange line shows full-employment or potentialoutput. 8,000 7,000 Actual and Potential Real GDP (Billions of 1996 Dollars) 6,000 The green line showsactualoutput. During recessions, output declines. 5,000 4,000 During expansions, output rises—sometimes rapidly. 3,000 2,000 1960 1965 1970 1975 1980 1985 1990 1995 2000 2003 Fig. 1a Potential and Actual Real GDP and Employment, 1960-2003
140 Employment (Millions) 120 Employment falls in recessions . . . 100 and rises in expansions. 80 60 1960 1965 1970 1975 1980 1985 1990 1995 2000 2003 Fig. 1b Potential and Actual Real GDP and Employment, 1960-2003
The unemployment rate rises during recessions . . . 12 10 and generally falls during expansions. 8 Unemployment Rate (Percent) 6 4 2 1960 1965 1970 1975 1980 1985 1990 1995 2000 2003 Fig. 2 U.S. Unemployment Rate, 1960-2003
Real Wage Rate Employment Fig. 3 A Recession Caused by Declining Labor Demand? Labor Supply E $15 F 12 Normal Labor Demand Recession Labor Demand ? 70 Million 100 Million
Real Wage Rate Employment Fig. 4 A Recession Caused by Declining Labor Supply? Recession Labor Supply? G Normal Labor Supply $18 E 15 Labor Demand 70 Million 100 Million