Download
1 / 6
60 likes | 201 Views
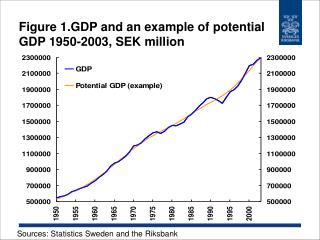
Figure 1.GDP and an example of potential GDP 1950-2003, SEK million. Sources: Statistics Sweden and the Riksbank. Figure 2. Productivity growth (GDP per hour worked) 1981-2003, per cent. Sources: Statistics Sweden and the Riksbank. Figure 3. Change in number of hours worked 1981-2003, per cent.

E N D
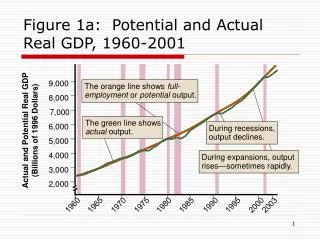
Figure 1.GDP and an example of potential GDP 1950-2003, SEK million Sources: Statistics Sweden and the Riksbank
Figure 2. Productivity growth (GDP per hour worked) 1981-2003, per cent Sources: Statistics Sweden and the Riksbank
Figure 3. Change in number of hours worked 1981-2003, per cent Sources: Statistics Sweden and the Riksbank
Figure 4. Population growth and change in age group 20-64 years in the population 1981-2020 (forecast 2004-2020), per cent Source: Statistics Sweden
Figure 5. Percentage of working age population in the labour force and degree of employment, level (left scale) and change (right scale) 1980-2003, per cent Sources: Statistics Sweden and the Riksbank
Figure 6. Percentage of people in work and the number of hours worked per person in work 1980-2003, index (1980=100) Sources: Statistics Sweden and the Riksbank