Download
1 / 20
200 likes | 282 Views
Bright blue marble spinning in space. Ecology Part 2. Trade-offs: survival vs. reproduction. The cost of reproduction increase reproduction may decrease survival investment per offspring reproductive events per lifetime age at first reproduction.

E N D
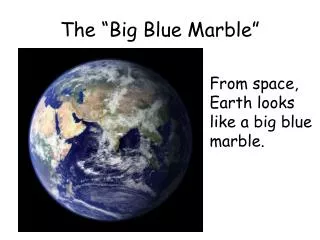
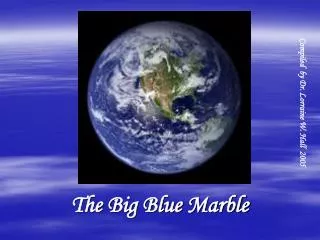
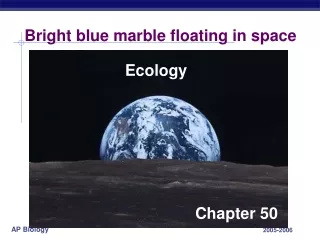
Bright blue marble spinning in space Ecology Part 2
Trade-offs: survival vs. reproduction • The cost of reproduction • increase reproduction may decrease survival • investment per offspring • reproductive events per lifetime • age at first reproduction Natural selection favors a life history that maximizes lifetime reproductive success
Parental survival Kestrel Falcons: The cost of larger broods to both male & female parents
Reproductive strategies • K-selected • late reproduction • few offspring • invest a lot in raising offspring • primates • coconut • r-selected • early reproduction • many offspring • little parental care • insects • many plants K-selected r-selected
Trade offs Number & size of offspring vs. Survival of offspring or parent r-selected K-selected “Of course, long before you mature, most of you will be eaten.”
1000 Human (type I) Hydra (type II) 100 Survival per thousand Oyster (type III) 10 1 0 25 50 75 100 Percent of maximum life span Life strategies & survivorship curves K-selection r-selection
Population growth change in population = births – deaths Exponential model (ideal conditions) dN = riN dt growth increasing at constant rate N = # of individuals r = rate of growth ri = intrinsic rate t = time d = rate of change every pair has 4 offspring every pair has 3 offspring intrinsic rate= maximum rate of growth
Exponential growth rate • Characteristic of populations without limiting factors • introduced to a new environment or rebounding from a catastrophe Whooping crane coming back from near extinction African elephant protected from hunting
Regulation of population size • Limiting factors • density dependent • food supply, competition • predators • disease • density independent • abiotic factors • sunlight • temperature • rainfall
gypsy moth Introduced species • Non-native species • transplanted populations grow exponentially in new area • out-compete native species • loss of natural controls • lack of predators, parasites, competitors • reduce diversity • examples • African honeybee • gypsy moth • zebra mussel • purple loosestrife kudzu
Zebra mussel ~2 months ecological & economic damage
1968 1978 Purple loosestrife • reduces diversity • loss of food & nesting sites for animals
Logistic rate of growth • Can populations continue to grow exponentially? Of course not! no natural controls K =Carryingcapacity effect of natural controls
10 8 Number of breeding male fur seals (thousands) 6 4 2 0 1915 1925 1935 1945 Time (years) 500 400 Number of cladocerans (per 200 ml) 300 200 100 0 0 10 20 30 40 50 60 Time (days) Carrying capacity • Maximum population size that environment can support with no degradation of habitat • varies with changes in resources
Changes in Carrying Capacity • Population cycles • predator – prey interactions
Population of… China: 1.3 billion India: 1.1 billion Significant advances in medicine through science and technology Industrial Revolution Human population growth adding 82 million/year What factors have contributed to this exponential growth pattern? 20056 billion Bubonic plague "Black Death" 1650500 million
Distribution of population growth 11 uneven distribution of population: 90% of births are in developing countries 10 high fertility 9 uneven distribution of resources: wealthiest 20% consumes ~90% of resourcesincreasing gap between rich & poor There are choices as to which future path the world takes… medium fertility 8 7 low fertility 6 World total World population in billions the effect of income & education 5 4 Developing countries 3 2 1 Developed countries 0 1900 1950 2000 2050 Time
USA 30.2 Germany 15.6 Brazil 6.4 Indonesia 3.7 Nigeria 3.2 India 2.6 0 2 4 6 8 10 12 14 16 18 20 22 24 26 28 30 32 34 Acres Amount of land required to support an individual at standard of living of population Ecological Footprint over-population or over-consumption? uneven distribution: wealthiest 20% of world: 86% consumption of resources 53% of CO2 emissions
Ecological Footprint deficit surplus Based on land & water area used to produce allresourceseach country consumes & to absorb allwastesit generates