Download
1 / 20
200 likes | 314 Views
Explore histograms, boxplots, and stemplot techniques to understand data distribution patterns. Learn about center, spread, and identifying outliers in datasets for robust analysis.

E N D
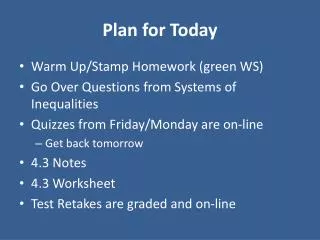
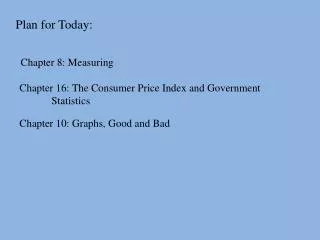
Plan for Today: Chapter 11: Displaying Distributions with Graphs Chapter 12: Describing Distributions with Numbers
Histograms Pie chart and bar graph are the common graphs of the distribution of a categorical variable. Histogram is the most common graph of the distribution of a quantitative variable.
Histograms implies number number /percentage at this range the obs from 85 to 95 Note: There is no space between bars.
Overall Pattern of a Distribution The center and the spread. See if the distribution has a simple shape that you can describe in a few words.
Histograms: center and the spread Histogram A Histogram B
Histograms: shape Symmetric: if the right and left sides of the histogram are approximately mirror images of each other.
Histograms: shape Skewed to the right: if the right side of the histogram extends much farther out than left side.
Histograms: shape Skewed to the left: if the left side of the histogram extends much farther out than right side.
Stemplot A stemplot (a.k.a. stem-and-leaf plot) is quicker to make and presents more detailed information.
Stemplot The max temperatures for the first 11 days this February at West Lafayette (I faked the number 19). 56 49 55 42 48 36 36 35 33 38 19 Largest place value Next place to the right 1 9 2 3 35668 4 289 5 56 Keep this row even you don’t have any 20s Duplicates have to be labeled separately.
Boxplots: The median M is the midpoint of a distribution. Half the observation are smaller that M and the other half are larger. How to find the median: 1) Arrange all observations in order of size, from smallest to largest. 2) If the number of observations n is odd, the median M is the center observation in the ordered list. 3) If the number of observations n is even, the median M is the average of the two center observations in the ordered list.
Boxplots: The median divided the sequence into left/right subgroups. The first quartile Q1is the median of the left subgroup. The third quartile Q3is the median of the right.
Boxplots: Q1 = 10.5 Q3 = 26 [ ] 7 9 10 11 14 17 19 20 21 25 27 29 30 [ ] median
Boxplots (without Outliers): 25% of the data 25% of the data median Minimum Maximum 25% of the data Q1 Q3 25% of the data Without outliers
Outliers: The interquartile range (IQR) is the distance between first quartile Q1and third quartile Q3. IQR = Q3 – Q1 Any data observation which lies more than 1.5*IQR lower than the first quartile or 1.5*IQR higher than the third quartile is considered an outlier. IQR 1.5*IQR 1.5* IQR Median Q1 Q3
Modified Boxplots (with Outliers) Minimum(since we don’t have any outliers Largest non-outlier point With outliers
Center and Spread : We often use two indexes to measure the central tendency: 1) Median 2) Mean/ average: sample mean:
Center and Spread : We often use two indexes to measure the variability or “spread” : 1) Interquartilerange (IQR) 2) Standard deviation (std dev): sample std dev: sample variance:
Center and Spread : Mean and standard deviation have better numerical properties. The median, Q1, Q3 suffer less impact at the present of outliers.
Center and Spread : The max temperatures for the first 10 days this February at West Lafayette. The researcher made a typo when he recorded the value 49. Before: 56 49 55 42 48 36 36 35 33 38 After: 56 149 55 42 48 36 36 35 33 38