Sampling Variability and Distribution
Learn how sampling variability impacts the behavior of means and find out more about population parameters and sample statistics. Identify populations, parameters, samples, and statistics in real-world scenarios. Explore the concept of unbiased estimators.

Sampling Variability and Distribution
E N D
Presentation Transcript
Sampling Variability Section 8.1
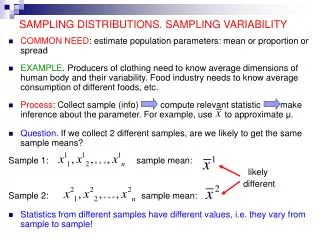
Sampling Distribution • Represents the long run behavior of the mean when sample after sample is selected. • It is used to find out more about a parameter of a population.
Parameter • Quantity computed from values in a population • Usually not known
Statistic • Quantity computed from values in a sample. • Computed directly from sample data
Identify the population, parameter, sample and statistic. The Gallup Poll asked a random sample of 515 U.S. adults whether or not they believe in ghosts. Of the respondents, 160 said “yes.”
Identify the population, parameter, sample and statistic. On Tuesday, the bottles of Arizona Iced Tea filled in a plant were supposed to contain an average of 20 ounces of iced tea. Quality control inspectors sampled 50 bottles at random from the day’s production. These bottles contained an average of 19.6 ounces of iced tea.
Identify the population, parameter, sample and statistic. On a New York-to-Denver flight, 8% of the 125 passengers were selected for random security screening before boarding. According to the Transportation Security Administration, 10% of passengers at this airport are chosen for random screening.
Sampling Variability The observed value of a statistic will depend on the sample selected. In other words – it will vary from sample to sample.
Sampling Distribution • Distribution of the values of a statistic • Notice what the relationship is between the mean of the population & the sample.
Abby -24Bill – 25Cindy- 26Dave – 27Ed – 28 Find the sampling distribution if we look at samples of size 2. (sample with replacement – do all combinations!)
Unbiased Estimator If the mean of the sampling distribution is equal to the true value of the parameter being estimated.
Homework • Page 428 (1-19)odd, (21-24)