Quantitative Structure-Activity Relationships (QSAR)
Quantitative Structure-Activity Relationships (QSAR).

Quantitative Structure-Activity Relationships (QSAR)
E N D
Presentation Transcript
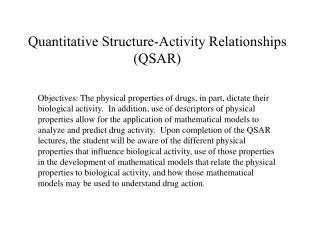
Quantitative Structure-Activity Relationships (QSAR) Objectives: The physical properties of drugs, in part, dictate their biological activity. In addition, use of descriptors of physical properties allow for the application of mathematical models to analyze and predict drug activity. Upon completion of the QSAR lectures, the student will be aware of the different physical properties that influence biological activity, use of those properties in the development of mathematical models that relate the physical properties to biological activity, and how those mathematical models may be used to understand drug action.
QSAR: Systematic approach to lead compound optimization Assume drug action is related to the physical properties of the ligand. Historical Galileo Galilei (1564-1642) Richet (1893) Overton and Meyer (1890’s) Ferguson
Applications of QSAR(Hansch Analysis) 1) Classification 2) Diagnosis of Mechanism of Drug ActionB.A. = 0.94 logP + 0.87, r = 0.97, n = 51 3) Prediction of Activity (congeneric series) 4) Lead Compound Optimization
Sulmazole Systematic approach to relate physical properties to activity that is applicable for a large number of chemical and biological systems
Hammett electronic parameter or substituent constant, s Equilibrium between the unionized and ionized forms of benzoic acid and the definition of Ka Note: pKa = - log Ka
Positive versus negative s values for chemical substituents, x. Positive s; electron withdrawing, log (Kx/KH) > 1 Negative s; electron donating, log (Kx/KH) < 1 Substituent effects contributing to s Meta: inductive (through space and through bond) Para: resonance Ortho: minimal transferability Multiple substituents on a compound: additive treatment of s
Example of resonance forms that stabilize the negatively charged carboxylate in p-nitrobenzoic acid
General utility of values:Saponification of substituted ethyl benzoates • Measure k for training set of compounds • Plot s versus k, determine slope • Relate electronic effects to k positive slope indicates electron withdrawing groups favor k negative slope indicates electron donating groups favor k • Predict k for unknown compounds • Generality is that the same values may be applied to all reactions and equilibria, such that they do not have to be re-determined for every study.
The Hammett constants, s,, can be related to the free energy ofionization via the vant Hoff relationship (In this case s would correspond to the equilibrium constant, K, allowing for Hammett relationships to also be referred to as a linear free energy relationship (LFER)).
Ester hydrolysis reaction and equation used to define the Taft steric parameter, Es Es is always 0 or negative
Consideration of asymmetric shape of functional groups and molecules in QSAR Verloop steric parameter Solvent Accessible Surface
Application of QSAR to biological systems (Biological Hammett Relationship):Hansch, 1962 Consideration of need to cross membranes Blood brain barrier Lipophilicity (hydrophobicity)
Equations for the determination of the partition coefficient, P, and the hydrophobicity parameter, px
Determination of partition coefficient, P Experimentally Shaker flask Reversed phase HPLC Computationally Fragmental constants, fi Interaction factors, Fi
Example of calculation of log P log P of benzene = 2.5 (parent compound)fi of methyl = 0.6fi or aromatic fluorine = -0.4Fi for fluorine atom ortho to a methyl group is -0.3 log P= 2.5 + 0.6 + (-0.4) + (-0.3) = 2.4
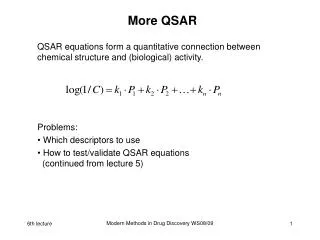
Example of a linear equation where multiple variables are used to obtain a correlation with biological activity (1/C). Why use log(1/C)?
Multiple Regression AnalysisHypothetical training set of biological activities, hydrophobicities and sigma values
Individual plots of log(1/C) versus p or s, includingleast-squares analysis BA = -0.63 p + 1.20, r2 = 0.73 BA = 0.37 s + 0.30, r2 = 0.49
Example of multiple regression least squares fitting Influence of variables (coefficients) on the agreement between the experimental and calculated activities
Application of multiple regression to the training set BA = -0.51 p + 0.23 s + 0.90, r2 = 0.90 Versus (from linear regression) BA = -0.63 p + 1.20, r2 = 0.73 and BA = 0.37 s + 0.30, r2 = 0.49
Multiple regression alonestill didn’t work! Need to consider transport from aqueous environment through a cell membrane and back into an aqueous environment
Example of an extended Hansch Equation where the Taft steric parameter, Es, has been included.
Advantages of Hansch analysis A) Use of descriptors (p, s, Es etc.) from small organic molecules may be applied to biological systems. B) Predictions are quantitative and may be evaluated statistically. C) Quick and easy. D) Potential extrapolation: conclusions reached may be extended to chemical substituents not included in the original analysis.
Disadvantages of Hansch analysis A) Descriptors required for substituents being studied. B) Large number of compounds required (training set for which physicochemical parameters and biological activity is available). C) Limitations associated with using small molecule descriptors, such as steric factors, on biological systems (i.e. descriptors from physical chemistry). D) Partial protontation of drugs at physiological conditions (can be included in mathematical model). E) Predictions limited to structural class (congeneric series). F) Extrapolations beyond the values of descriptors used in the study are limited. G) Correlation between physical descriptors. For example, the hydrophobicity will have some correlation with the size and, thus, the Taft steric term.
QSAR interpolations versus extrapolations Spanned Substituent Space (SSS): range of physical properties covered by the compounds in the training set. Interpolative predictions: within SSS Extrapolative predictions: beyond SSS SSS
Statistical Significance in QSAR Minimum of 5 compounds per term in the Hansch equation.
Free and Wilson Model BA = S Iij Fij + k log(1/C) = Ii,1Fi,1 + Ii,2Fi,2 + Ii,3Fi,3 + Ii,4Fi,4 + k
Example of Free and Wilson Approach A) methyl at position 1, amine at position 3 and methyl at position 4 log(1/C) = 0.4 + 0.0 + (-0.5) + 0.3 + 0.0 = 0.2 B) -CN at position 1, methyl at position 2 and amine at position 4 log(1/C) = 1.8 + 0.6 + 0.0 + 0.1 + 0.0 = 2.5
Combine QSAR and Free and Wilson Km for hydrolysis of esters by papain by amides and sulfonamides log(1/Km) = 0.57 MR + 0.56 - 1.92 I + 3.74
Topliss Decision Tree for a Sulfa Drug Measure activity of unsubstituted compound Add substitutent with significant or value while keeping the other physical property close to zero Measure activity of new compound Select new substituent based on change in activity Synthesize new compound and iterate over steps C, D and E.
Craig plot of hydrophobicity versus the Taft Steric Term, Es
Batchwise Approach H; 3,4-Cl; 4-Cl; 4-CH3; 4-OCH3 A) Synthesize all of the above 5 analogs for the compound being studied.B) Experimentally determine biological activity of 5 analogs and obtain the order of the activity from highest = 1 to lowest = 5. C) Based on order from step B, find which column in the following table corresponds to that order. This identifies which descriptor (i.e. p or s) and its sign are important for improving the biological activity.D) Go to the second table, identify the row that corresponds to the p or s relationship determined in step C and identify substitutents to add to the compound to further increase activity.
Potency order for various Parameter Dependencies for the Batchwise Approach
New substituent selections based on parameter dependencies from the Batchwise approach
Example of Batchwise approach Measured order of biological activity:4 > 5 > 2 = 3 > 1or 4–CH3 > 4-OCH3 > 3,4-Cl2 = 4-Cl > H
Substituent p sm sp Es -H 0.00 0.00 0.00 0.0 -CH3 0.56 -0.07 -0.17 -1.2 -CH2CH3 1.02 -0.07 -0.15 -1.3 -CH2CH2CH3 1.55 -0.07 -0.13 -1.6 -CH(CH3)2 1.53 -0.07 -0.15 -1.7 -OCH3 -0.02 0.12 -0.27 -0.5 -Phenyl 1.96 0.06 -0.01 -3.8 Physiochemical parameters used in QSAR Investigations.
-NH2 -1.23 -0.16 -0.66 -0.6 -F 0.14 0.34 0.06 -0.4 -Cl 0.71 0.37 0.23 -0.9 -Br 0.86 0.39 0.23 -1.1 -I 1.12 0.35 0.18 -1.4 -CF3 0.88 0.43 0.54 -2.4 -OH -0.67 0.12 -0.37 -0.5 -COCH3 -0.55 0.38 0.50 -1.51 -COOCH31 0.01 0.50 0.56 -1.8 -NHCOCH3 -0.97 0.21 0.00 -2.81 -NO2 -0.8 0.71 0.78 -2.5 -CN -0.57 0.56 0.66 -0.5 -N+(CH3)3 -0.25 0.78 0.50 -2.31 -COOH -0.16 0.36 0.45 -1.41
Additional descriptors for Hansch Analysis pKa (limited to ionizable compounds)chemical shifts from NMRredox potentialsdipole momentsquantum mechanical derived propertiesatomic chargesHOMO and LUMO orbital energieselectrostatic potential around a molecule (like a magnetic field)
3D QSAR or Compartive Molecular Field Analysis (CoMFA) QSAR approach to deal with interactions of molecules with their environment taking into account 3D shape. Electrostatic and Steric interactions at selected points around molecules replace physical parameters in normal QSAR