Download

1 / 23
230 likes | 246 Views
This study analyzes the factors that contribute to geographic variation in healthcare spending, including prices for medical services, health and illness status of residents, regional preferences for healthcare services, and residual variation. It also explores the impact of chronic conditions, smoking prevalence, and behaviors such as poor diet and lack of physical activity on healthcare spending.

E N D
Health StatusHealth Behavior and Variability in Healthcare Spending RADM Penelope Slade-Sawyer, P.T., M.S.W.Department of Health and Human Services (DHHS) Director, Office of Disease Prevention and Health Promotion Acting Director, President’s Council on Physical Fitness and Sports Office of the Secretary, Office of Public Health and Science
Factors Contributing to Geographic Variation in Health Care Spending • Prices paid for medical services • Health and illness status of residents of a given region • Regional preferences about the use of healthcare services • Residual variation Congressional Budget Office, Geographical Variation in Health Care Spending, 2008
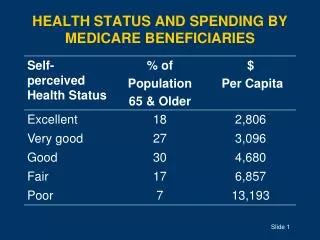
Two thirds of Medicare spending is for people with five or more chronic conditions
Percent of Healthcare Spending for Individuals with chronic conditions by type of insurance
People with Multiple Chronic Conditions are much more likely to be hospitalized
Spending for inpatient hospital care increases with the number of chronic conditions
Healthcare Spending Increases with the Number of Chronic Conditions
The Five Most Costly Conditions as a Percentage of Total Health Expenditures: United States, 2002 Source: Olin GL, Rhoades JA. The five most costly medical conditions, 1997 and 2002: estimates for the U.S. civilian noninstitutionalized population. Statistical Brief #80. Agency for Healthcare Research and Quality, Rockville, MD. Web site: http://www.meps.ahrq.gov/mepsweb/data_files/publications/st80/stat80.pdf. Accessed April 7, 2006.
Smoking Prevalence of Adults* by state Source: Behavioral Risk Factor Surveillance System (BRFSS), 2006
Developing chronic diseases is not an inevitable consequence of aging Behaviors • Poor diet (low fruit and vegetable intake) • High cholesterol • High blood pressure • Lack of physical activity • Tobacco use Chronic Diseases • Type 2 diabetes • congestive heart failure • Stroke • hypertension
Overweight and obesity raise the risk for: type 2 diabetes high blood pressure high cholesterol levels coronary heart disease congestive heart failure angina pectoris stroke asthma osteoarthritis musculoskeletal disorders gallbladder disease sleep apnea and respiratory problems gout bladder control problems poor female reproductive health – complications of pregnancy – menstrual irregularities – infertility – irregular ovulation cancers of the – uterus – breast – prostate – kidney – liver – pancreas – esophagus – colon and rectum
Geographic variation in Public Health Spending is even greater than variation in Medicare Spending • Public Health Activities • Monitor community health status • Investigate and control disease outbreaks • Educate the public about health risks and prevention strategies • Enforce public health laws and regulations • Inspect and assure the safety and quality of water, air, and other resources necessary for good health • Public Health Spending • State government’s per capita spending on public health activities varied by a factor of 30 in 2003 (more than 400$ per person in Hawaii, less than $75 per person in Iowa) • Variation even great on the local level (less than 1$ per capita to more than 200$ per capita in 2005)
Glen P Mays, Sharla A. Smith. Geographic Variation in Public Health spending: correlates and consequences. Public Health Services and Systems Research. 2009.
Percentage of Adults Who Are Obese,* by State *Body mass index > 30, or ~ 30 pounds overweight for a 5'4" person. Source: CDC, Behavioral Risk Factor Surveillance System.
Black Non-Hispanic White – Non Hispanic Hispanic Differences in Prevalence of Obesity 2006--2008 Source: CDC, MMWR. Differences in Prevalence of Obesity Among Black, White, and Hispanic Adults --- United States, 2006--2008 . For this study analysis, CDC analyzed the 2006−2008 BRFSS data.
Prevalence of Physical Activity*, 2007 *Recommended physical activity is defined as at least 5 days a week for 30 minutes a day of moderate intensity activity or at least 3 days a week for 20 minutes a day of vigorous intensity activity
Percentage of U.S. adults aged ≥ 18 years who consumed fruit two or more times/day and vegetables three or more times/day, by state (2007) Source: Behavioral Risk Factor Surveillance System 2007
National Average = 7.8% < 5.9% 6% – 6.9% 7% – 7.9% ≥ 8% Percent of Adults Ages 18+ with Diagnosed Diabetes, by State, 2007 Source: Centers for Disease Control and Prevention. (2009). Percentage of Adults with Diagnosed Diabetes By State, 2007. Link: http://apps.nccd.cdc.gov/DDTSTRS/StateSurvData.aspx.
County Level Estimates of Diagnosed Diabetes — Percentage of Adults in Colorado, 2005 County Level Estimates of Diagnosed Diabetes — Percentage of Adults in Texas, 2005
Healthy People 2010 Overarching goals: 1) increase quality and years of healthy life 2) eliminate health disparities Focus Areas include • Physical Activity and Fitness • Nutrition and Weight Status • Diabetes • Heart Disease and Stroke • Tobacco Use • Cancer • Examples of New Objectives (for Healthy People 2020) • Early and Middle Childhood Health, Adolescent Health • Healthcare Associated Infections
By changing the way they live, Americans could change their personal health status and the health landscape of the Nation dramatically.