Download
1 / 1
10 likes | 88 Views
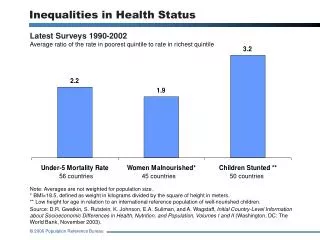
Explore inequalities in health status from 1990-2002 surveys in 56 countries. Average ratio of health rates between richest and poorest quintiles. Data on BMI & low height for age. Source: The World Bank.

E N D
Inequalities in Health Status Latest Surveys 1990-2002 Average ratio of the rate in poorest quintile to rate in richest quintile 56 countries 45 countries 50 countries Note: Averages are not weighted for population size. * BMI<18.5, defined as weight in kilograms divided by the square of height in meters. ** Low height for age in relation to an international reference population of well-nourished children. Source: D.R. Gwatkin, S. Rutstein, K. Johnson, E.A. Suliman, and A. Wagstaff, Initial Country-Level Information about Socioeconomic Differences in Health, Nutrition, and Population, Volumes I and II (Washington, DC: The World Bank, November 2003).