Download
1 / 29
290 likes | 429 Views
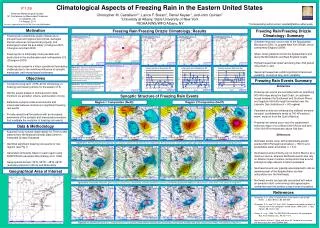
Climatological Aspects of Freezing Rain in the Eastern U.S. Christopher M. Castellano, Lance F. Bosart, and Daniel Keyser Department of Atmospheric and Environmental Sciences University at Albany, State University of New York, Albany, NY John Quinlan and Kevin Lipton NOAA/NWS/WFO Albany, NY

E N D
Climatological Aspects of Freezing Rain in the Eastern U.S. Christopher M. Castellano, Lance F. Bosart, and Daniel Keyser Department of Atmospheric and Environmental Sciences University at Albany, State University of New York, Albany, NY John Quinlan and Kevin Lipton NOAA/NWS/WFO Albany, NY Northeast Regional Operational Workshop XIII 3 November 2011, Albany, NY NOAA/CSTAR Grant: NA01NWS4680002
Outline • Motivation and Objectives • Data and Methodology • Freezing Rain Climatology • Significant Freezing Rain Events • Summary
Motivation • Freezing rain undermines public infrastructure, disrupts local and regional economies, and endangers human life and safety • Freezing rain presents a major forecast challenge due to the combined influence of synoptic, mesoscale and microphysical processes • Freezing rain is historically most prevalent and destructive in the eastern U.S.
Motivation Fig 2. Changnon (2003). The amount of loss (millions of dollars expressed in 2000 values) from ice-storm catastrophes in each climate region during 1949–2000. Values in parentheses are the average losses per catastrophe. Fig 3. Changnon (2003). The number of ice-storm catastrophes in each climate region during 1949–2000. Values in parentheses are those catastrophes that only occurred within the region.
Objectives • Construct a long-term (1975–2010) climatology of freezing rain for the eastern U.S. • Identify significant freezing rain events based on duration, ice accretion/damage, spatial characteristics, and thermal structure • Determine synoptic-scale environments and mesoscale features conducive to significant freezing rain events • Provide forecasters with greater situational awareness of synoptic and mesoscale processes that modulate the evolution of freezing rain events
Objectives • Construct a long-term (1975–2010) climatology of freezing rain for the eastern U.S. • Identify significant freezing rain events based on duration, ice accretion/damage, spatial characteristics, and thermal structure • Determine synoptic-scale environments and mesoscale features conducive to significant freezing rain events • Provide forecasters with greater situational awareness of synoptic and mesoscale processes that modulate the evolution of freezing rain events
Data and Methodology • Freezing Rain Climatology: • Acquired hourly surface observations for 91 first-order stations from NCDC’s Integrated Surface Database • Analyzed the temporal and spatial variability of freezing rain and freezing drizzle • Significant Freezing Rain Events: • Identified significant freezing rain events at two stations: Greensboro, NC [GSO] and Worcester, MA [ORH] • Generated synoptic composite maps for significant events at each station using 2.5° NCEP/NCAR reanalysis data
Data and Methodology: Definitions • Geographical domain: 32°N, 90°W – 48°N, 66°W • Freezing rain event: 1+ h of measureable freezing rain (FZRA) and/or freezing drizzle (FZDZ) • Significant freezing rain event: 6+ h of measureable freezing rain (FZRA) observed within a 24-h period * Sequential FZRA/FZDZ observations must be within 6 h of each other to be considered part of the same event
Domain and First-Order Stations ORH GSO
Climatology: Freezing Rain Hours Average number of hours of freezing rain/freezing drizzle per season.
Climatology: Freezing Rain Events Average number of freezing rain events per season.
Climatology: Significant FZRA Events Average number of significant freezing rain events per season.
Climatology: Significant Event Ratio Percentage of freezing rain events qualifying as “significant.”
Analysis of Significant Freezing Rain Events • Identified 38 significant events at GSO and 44 significant events at ORH • Examined 500-hPa geopotential heights and anomalies • Examined 300-hPa wind speed, 1000–500-hPa thickness, and mean sea-level pressure • Examined 850–700-hPa layer winds, precipitable water, and standardized precipitable water anomalies • Performed analyses at t = 0 and t − 24 h preceding events
500-hPa geopotential height (black contours, every 60 m) and anomalies (shaded, every 30 m) N = 38
500-hPa geopotential height (black contours, every 60 m) and anomalies (shaded, every 30 m) N = 38
300-hPa wind speed (shaded, every 5 m s-1), 1000–500-hPa thickness (dashed contours, every 6 dam), and mean sea-level pressure (solid contours, every 4 hPa) N = 38
300-hPa wind speed (shaded, every 5 m s-1), 1000–500-hPa thickness (dashed contours, every 6 dam), and mean sea-level pressure (solid contours, every 4 hPa) N = 38
850–700-hPa layer wind (arrows, m s-1), 850–700-hPa layer 0°C isotherm (dashed contour), precipitable water (green contours, every 4 mm), and standardized precipitable water anomalies (shaded, every 0.5 σ) N = 38
850–700-hPa layer wind (arrows, m s-1), 850–700-hPa layer 0°C isotherm (dashed contour), precipitable water (green contours, every 4 mm), and standardized precipitable water anomalies (shaded, every 0.5 σ) N = 38
500-hPa geopotential height (black contours, every 60 m) and anomalies (shaded, every 30 m) N = 44
500-hPa geopotential height (black contours, every 60 m) and anomalies (shaded, every 30 m) N = 44
300-hPa wind speed (shaded, every 5 m s-1), 1000–500-hPa thickness (dashed contours, every 6 dam), and mean sea-level pressure (solid contours, every 4 hPa) N = 44
300-hPa wind speed (shaded, every 5 m s-1), 1000–500-hPa thickness (dashed contours, every 6 dam), and mean sea-level pressure (solid contours, every 4 hPa) N = 44
850–700-hPa layer wind (arrows, m s-1), 850–700-hPa layer 0°C isotherm (dashed contour), precipitable water (green contours, every 4 mm), and standardized precipitable water anomalies (shaded, every 0.5 σ) N = 44
850–700-hPa layer wind (arrows, m s-1), 850–700-hPa layer 0°C isotherm (dashed contour), precipitable water (green contours, every 4 mm), and standardized precipitable water anomalies (shaded, every 0.5 σ) N = 44
Summary: Freezing Rain Climatology • Greatest frequency of freezing rain hours observed east of the Appalachian Mountains, in upstate New York, and in central New England • Sharp gradients in frequency exist across the Appalachians and along the Mid-Atlantic and New England coasts • Greatest frequency of significant events also occurs east of the southern Appalachians and in the interior Northeast • Higher percentage of freezing rain events qualify as significant in the Southeast than anywhere else
Summary: Significant Freezing Rain Events Similarities • Freezing rain events are coincident with an amplifying 500-hPa ridge along the East Coast, an upstream trough between the Rockies and the Midwest, and negative 500-hPa geopotential height anomalies to the northeast • Freezing rain events occur near an equatorward entrance region of a confluent 300-hPa jet, within a 1000–500-hPa thickness ridge • Freezing rain events feature low-to-midlevel moisture transport and warm-air advection via deep southwesterly flow
Summary: Significant Freezing Rain Events Differences • ORH events feature more amplified upper-level height anomalies, thermal trough/ridge patterns, and moisture anomalies than GSO events • GSO events primarily rely on Gulf of Mexico as sole moisture source, whereas ORH events likely rely on Atlantic Ocean as an additional moisture source • GSO events are typically associated with cold-air damming east of the Appalachians • ORH events are typically associated with ageostrophic northerlies that reinforce cold air on the poleward side of a mature warm front