Very Large Array data
Very Large Array data. Loránt Sjouwerman National Radio Astronomy Observatory. Outline. Intro to the Very Large Array – VLA Visibility Data (i.e., not images) Calibration – instrument, atmosphere VLA data archive, raw and calibrated. The Very Large Array.

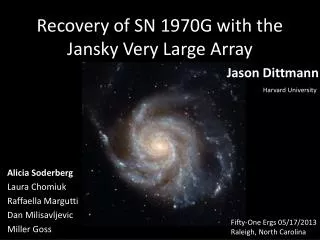
Very Large Array data
E N D
Presentation Transcript
Very Large Array data Loránt Sjouwerman National Radio Astronomy Observatory
Outline • Intro to the Very Large Array – VLA • Visibility Data (i.e., not images) • Calibration – instrument, atmosphere • VLA data archive, raw and calibrated
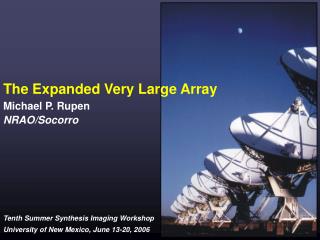
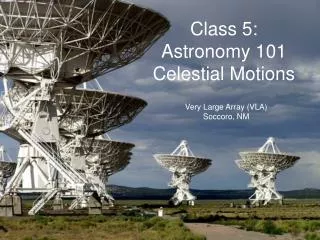
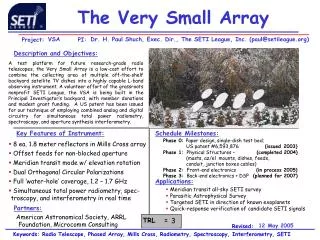
The Very Large Array • 27 movable 25m antennas in Y-shape • Observing at 74, 320 MHz, 1.2-1.7, 5, 8, 15, 21-25 and 40-50 GHz (4m-6mm) • Spread over max. 1,3,12,35 km baselines (D,C,B and A-configuration, PSF 14’-0.05”) • Min. baselines 40m (D) to 600m (A), largest angular scale spatial filter • Nearly 30 years of data • Current upgrade 1-50 GHz continuous with a wideband correlator ( EVLA)
The Very Large Array • VLA-D is most compact: 1km array (now in B) NRAO/AUI
Visibility data • Interferometers do not make images of the sky, they measure the spatial coherence of the electric field at different locations visibility function • Visibilities usually referred to as • Amplitude and Phase in (u,v)-plane • Also Real and Imaginary • Fourier Transform visibilities at many (u,v)-locations to obtain an image
Visibility data • Example: • Point source in field center • FT of -function • Amplitude • Phase
Visibility data • Example: • Point source in field center • FT of -function • Amplitude • Phase • Real • Imaginary
Visibility data • Example: • Complex sources • Source and sky structure in the visibilities (FT) • Add real world (atmosphere and instrument)
Calibration • Ideally visibilities are measured, known constant corrections are applied and a FT yields an image • Instrumental effects are slow-varying • Instrumental calibration • Antenna-based Amplitude and Phase • Atmospheric effects dominate • Ionosphere – Low frequency (« 10 GHz) • Troposphere – High frequency (» 10 GHz) • Antenna and baseline-based
Calibration • Typical to observe known “calibrator” • Structure (deviation from point-source) • Position (align antenna phases) • Flux density (align amplitudes) • Assume same corrections for either path • Interval vs time-scale of variations: • Instrumental: (fraction of) hours • Interpolate between calibrator scans • Atmospheric: (fraction of) minutes • Fast-switching or self-calibration
Movie ! • VLA 74 MHz, 1min snapshots • Grid of 9 sources • Position and intensity okay for instrument • Rest is due to ionosphere • “Good” data ! Kassim, Cotton, et al
Movie ! • VLA 74 MHz, 1min snapshots • Grid of 9 sources • Position and intensity okay for instrument • Rest is due to ionosphere • “Good” data ! Kassim, Cotton, et al
Calibration (cont’d.) • Calibration tables • A&P per antenna(-location) over time
Calibration • Antenna based amplitude and phase corrections over time mostly function of atmosphere • Because antennas are spread out, calibration tables contain information about atmospheric layer over array • Many calibration tables (and images too) already available in VLA archive
VLA archive • Contains “raw” multi-source vis. files • i.e., uncalibrated, many sky positions • Mixed frequency/BW settings, etc • Pipeline calibrated data • Calibrated multi-source • Calibration tables • Calibrated single source/position (10,000) • Visibility plots (Amplitude vs (u,v)-distance) • Real/Imaginary plots • Sky images at different t,, (50,000)
VLA archive • Official web address: • http://archive.nrao.edu • Currently under revision, so might be somewhat fragile till end of year (?) • And calibration tables might be missing • Back door: • http://www.vla.nrao.edu/~vlbacald • Direct access with some documentation and some simple search tools
http://archive.nrao.edu • Main portal • Advanced QT • General, (u,v) • Position/object • Telescope/array • Frequency • Line/continuum • Date • Image AT • Images
http://archive.nrao.edu • Main portal • Advanced QT • General, (u,v) • Position/object • Telescope/array • Frequency • Line/continuum • Date • Image AT • Images
http://archive.nrao.edu • Main portal • Advanced QT • General, (u,v) • Position/object • Telescope/array • Frequency • Line/continuum • Date • Image AT • Images
http://archive.nrao.edu • Main portal • Advanced QT • General, (u,v) • Position/object • Telescope/array • Frequency • Line/continuum • Date • Image AT • Images
www.vla.nrao.edu/~vlbacald • Back door • Full access to all pipeline products • No other clutter • Direct download • Note: pipeline did not self-cal targets yet • Can do better • Anticipated ’08
www.vla.nrao.edu/~vlbacald • Cone search • Name resolvers • Scaled radius • RMS, Frequency • Other VLA Images • Mostly just that • Browse pipeline • Position • Date • Project
www.vla.nrao.edu/~vlbacald • Note: mostly calibrators, i.e., very point-like • Links to other plots, parent multi-source data and pipeline scripts and logs
www.vla.nrao.edu/~vlbacald • Kepler:
www.vla.nrao.edu/~vlbacald • Supporting data & pipeline files • Binary FITS calibration tables; free! • Load in FITS table reader (I use AIPS)
Your turn • Demo during the break ? • Please try it out • I’m open for feedback